6. Ackerman and Goldsmith (2011) report that students who study from a screen (phone, tablet, or comput- er) tended to have lower quiz scores than students who studied the same material from printed pages. To test this finding, a professor identifies a sample of n 16 students who used the electronic ver- %3D sion of the course textbook and determines that this sample had an average score of M 72.5 on the final exam. During the previous three years, the final exam scores for the general population of students taking the course averaged p 77 with a standard deviation of o 8 and formed a roughly normal distribution. The professor would like to use the sample to determine whether students studying from an electronic screen had exam scores that are significantly different from those for the general population.
6. Ackerman and Goldsmith (2011) report that students who study from a screen (phone, tablet, or comput- er) tended to have lower quiz scores than students who studied the same material from printed pages. To test this finding, a professor identifies a sample of n 16 students who used the electronic ver- %3D sion of the course textbook and determines that this sample had an average score of M 72.5 on the final exam. During the previous three years, the final exam scores for the general population of students taking the course averaged p 77 with a standard deviation of o 8 and formed a roughly normal distribution. The professor would like to use the sample to determine whether students studying from an electronic screen had exam scores that are significantly different from those for the general population.

Glencoe Algebra 1, Student Edition, 9780079039897, 0079039898, 2018
18th Edition
ISBN:9780079039897
Author:Carter
Publisher:Carter
Chapter10: Statistics
Section10.4: Distributions Of Data
Problem 19PFA

Related questions
Question
I need assistance with #6 A and B
Transcribed Image Text:B Homework#7-Basic Stats BeX
B Homework#7 problem
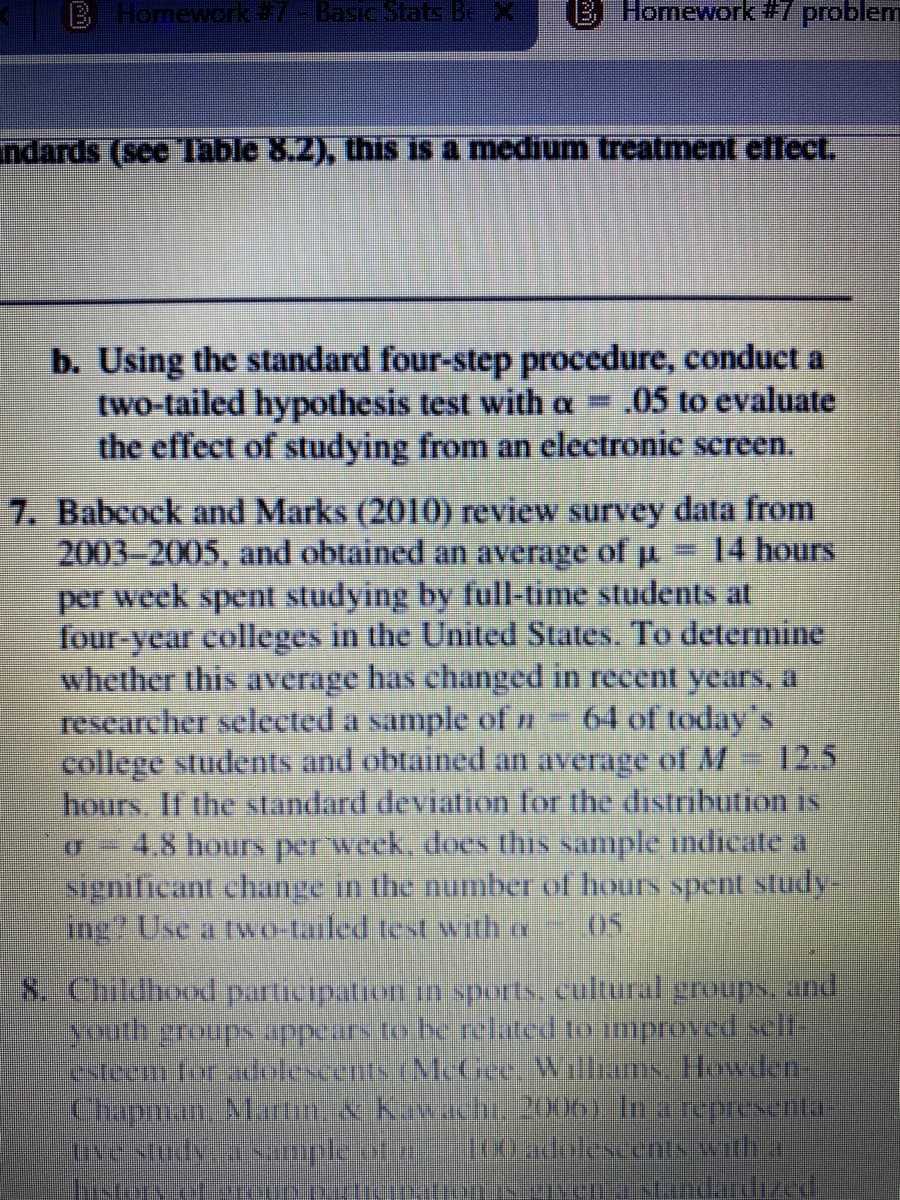
ndards (see Table 8.2), this is a medium treatment cflect.
b. Using the standard four-step procedure, conduct a
two-tailed hypothesis test with a = .05 to evaluate
the effect of studying from an electronic screen.
7. Babcock and Marks (2010) review survey data from
2003-2005, and obtained an average of u
per week spent studying by full-time students at
four-year colleges in the United States. To determine
whether this average has changed in recent years, a
researcher selected a sample of n
college students and obtained an average of M
hours. If the standard deviation for the distribution is
4.8 hours perweck. does this sample indicate a
significant change in the number of hours spent study-
ng? Use a tvwo-tailed test with re
14 hours
64 of today's
12.5
8. Childhood participation in sports, cultural groups. and
Southeroups appeirs to be related to improved selt
estecmfor dolescents (NL Gee Willims. Ilowdef-
Chapman Marn.skawach 20un) Inareprsental
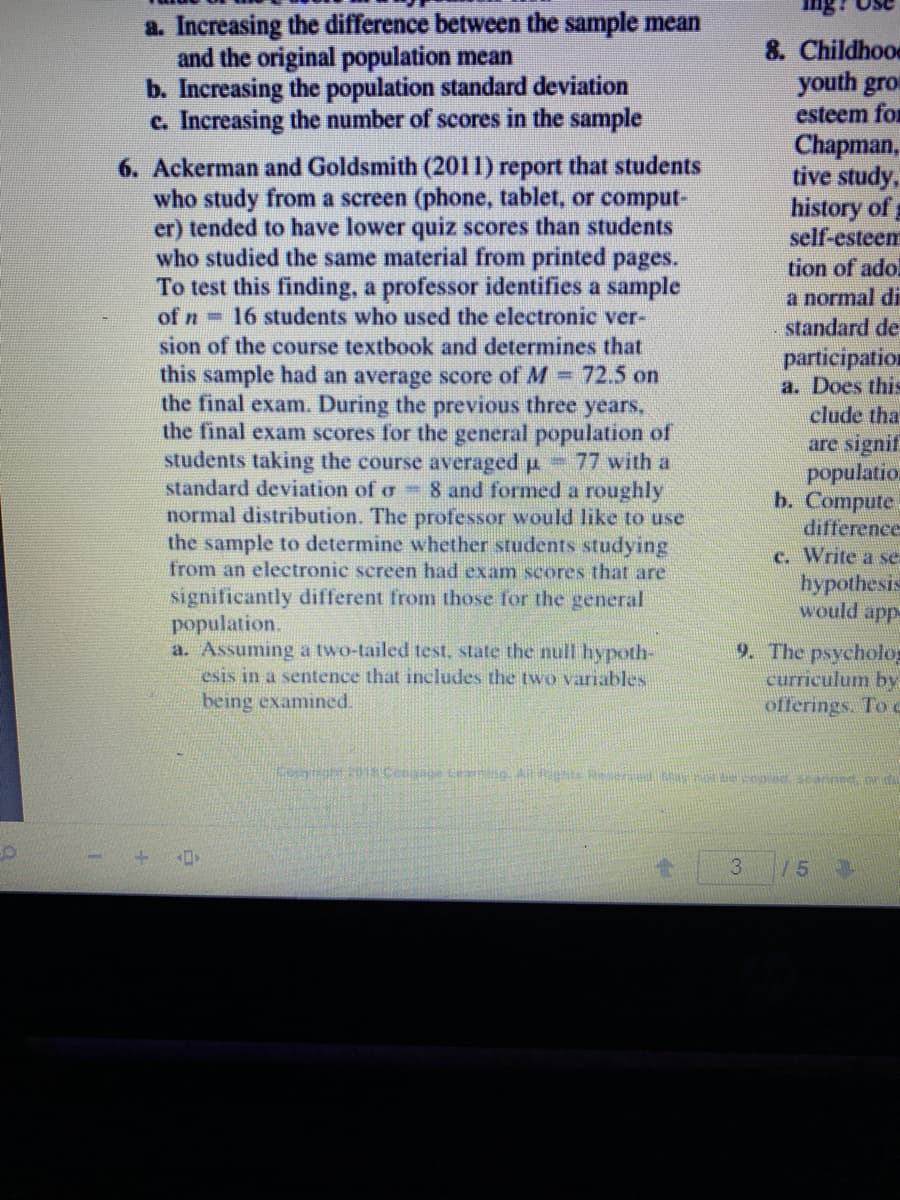
Transcribed Image Text:a. Increasing the difference between the sample mean
and the original population mean
b. Increasing the population standard deviation
c. Increasing the number of scores in the sample
8. Childhood
youth gro
esteem for
Chapman,
tive study,
history of
self-esteem
tion of adol
a normal di
standard de
6. Ackerman and Goldsmith (2011) report that students
who study from a screen (phone, tablet, or comput-
er) tended to have lower quiz scores than students
who studied the same material from printed pages.
To test this finding, a professor identifies a sample
of n 16 students who used the electronie ver-
sion of the course textbook and determines that
this sample had an average score of M 72.5 on
the final exam. During the previous three years,
the final exam scores for the general population of
students taking the course averaged p 77 with a
standard deviation of o 8 and formed a roughly
normal distribution. The professor would like to use
the sample to determine whether students studying
from an electronic screen had exam scores that are
participation
a. Does this
clude that
are signif
populatio
b. Compute
difference
c. Write a se
hypothesis
would app
significantly different from those for the general
population.
a. Assuming a two-tailed test, state the null hypoth-
esis in a sentence that includes the two variables
being examined.
9. The psycholo
curriculum by
offerings. To
oong20.Cengage Cea ng A nts Resered Sytecopd scanned n du
3
Expert Solution
This question has been solved!
Explore an expertly crafted, step-by-step solution for a thorough understanding of key concepts.

This is a popular solution!

Trending now
This is a popular solution!

Step by step
Solved in 5 steps

Knowledge Booster


Learn more about
Need a deep-dive on the concept behind this application? Look no further. Learn more about this topic, statistics and related others by exploring similar questions and additional content below.Recommended textbooks for you
Glencoe Algebra 1, Student Edition, 9780079039897…
Algebra
ISBN:
9780079039897
Author:
Carter
Publisher:
McGraw Hill
Glencoe Algebra 1, Student Edition, 9780079039897…
Algebra
ISBN:
9780079039897
Author:
Carter
Publisher:
McGraw Hill