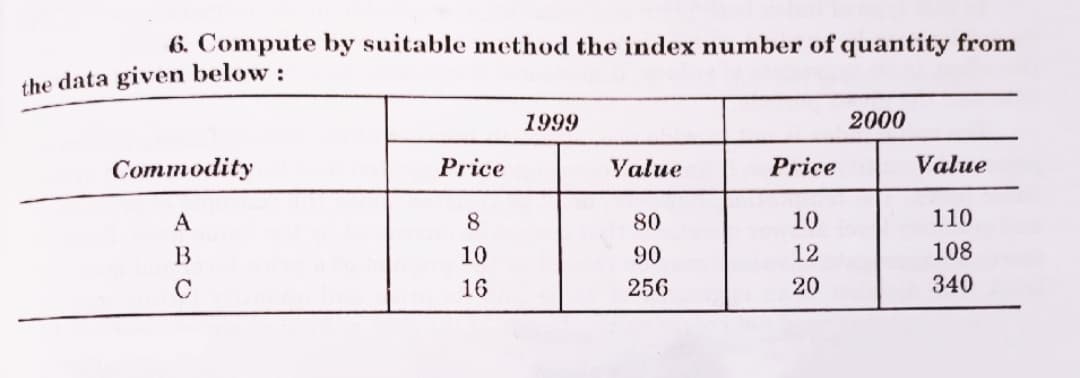
6. Compute by suitable method the index number of quantity from the data given below : 1999 2000 Commodity Price Value Price Value A 8 80 10 110 10 90 12 108 C 16 256 20 340


Q: On the Standford-Binet test, the mean IQ is 100. A class of 21 kindergarten pupils were tested with ...
A: We have given that Population mean( µ ) = 100 Sample size (n) = 21 Sample mean (x̅) = 98 Standard de...
Q: Consider a regression setting with input data XER® following a Gaussian distribution X~N(4, E). The ...
A:
Q: Match each of the following random variables to the most appropriate distribution for that random va...
A: 1) Binomial Explanation: Here total number of trials i.e. total number of expressed trains are fixed...
Q: "Given a standard normal distribution with mean =134 and standard deviation 38, find P(X>103)." A) 0...
A:
Q: On the Standford-Binet test, the mean IQ is 100. A class of 21 kindergarten pupils were tested with ...
A:
Q: Find the probability of showing a 4 on both rolls.
A: here 6 sided die rolled twice so total outcomes = 6×6 = 36 and Let E be the event "the first roll i...
Q: 1. Following data consisting missing observation (X) Commodities Po P1 А 1 10 2 В 1 5 where p and q ...
A:
Q: Fix the roads! ~ The Township Board of Meridian Township wants to know how much public support there...
A: Given90% confidence for the actual proportion is (0.57,0.62)upper bound=0.62lower bound = 0.57
Q: To determine the effect of a growth stimulant, 24 feedlot beef cattle were randomly assigned to thre...
A: Given The total number of cattle =24The total number of groups =3The total number of cattle in each ...
Q: For the number of flaws in a randomly chosen piece of wire. The following is the pmf: P(X - 0) = 0.2...
A:
Q: 11. A skilled typist on routine work, kept a record of mistakes per day during 300 working days. The...
A:
Q: The population mean and standard deviation are given below. Find the required probability and determ...
A:
Q: In an experiment, college students were given either four quarters or a $1 bill and they could eithe...
A:
Q: A nutritionist claims that children 13 to 15 years old are consuming less than the recommended iron ...
A: We have given that, Population standard deviation (σ) = 4.75 and margin of error (E) = 1 and confid...
Q: The price paid and quantities purchased by a household in base and current years are given below. Ca...
A:
Q: 1. X follows a normal distribution with mean 1.4 and standard deviation of 0.4. If X has a correspon...
A: As per our guidelines we are suppose to answer only one question. Given,mean(μ)=1.4standard deviatio...
Q: 4. N = 15,000 and e = 14% %3D 5. N= 22,000 and e = 2% %3D
A: Here use slovin's formula
Q: "Given a standard normal distribution with mean =80 and standard deviation = 36, find P(X>76)." A 0....
A: Given that u = 80 Sigma = 36 X = 76 Find P(x> 76) = ??? By using standard normal distribution...
Q: Calculate the coefficient of correlation between . and y from the following data : X 1 3 4 6. 7 Y 2 ...
A:
Q: Among all the children in the playground, 95.4% are between 1.1 m and 1.7 m tall. Assuming that the ...
A: Explanation:Here given the between values and calculate the mean and standard deviation In step2 fin...
Q: In a recent awards ceremony, the age of the winner for best actor was 28 and the age of the winner f...
A: GivenThe age of the winner for best actor was 28 withMean(μ)=42.3standard deviation(σ)=8.4The age of...
Q: A true-false test contains 24 questions. In how many different ways can this test be completed? (Ass...
A: Given,Total no.of questions=24
Q: A recent study found that 40% of all people over age of 62 wear hearing aids. If a random sample of ...
A:
Q: Calculate skewness from the following distribution. 6 x : 1 3 4 5 7 f:. 12 27 29 19 8 4 1
A:
Q: = 3 and X2 = 1. Compute the MLE for p if you know that p is an We observe a sample of size 2 for whi...
A: It is given that Sample of size 2 : X1 = 3, X2 = 1 We have to calculate the MLE of parameter p.
Q: If the area to the left of x in a normal distribution is 0.842, what is the area to the right of x? ...
A:
Q: Compute the mean of the random variable with the given discrete probability distribution. P(x) 0.2 1...
A:
Q: Question 1 Suppose the length of time (in hours) of a long-distance business video call is Y = 2X04,...
A: Ans
Q: When doing polling, for instance to figure out how popular a given candidate is, a common trick is t...
A: From the given information, a fair coin was flipped. If it comes HEADS, candidate can answer honestl...
Q: 10. Mingming, Mark's cat, recently got pregnant and is expecting 6 cubs according on her doctor. Mar...
A: According to the given information in this question It follows binomial distribution with parameters...
Q: 1) Suppose the following model y; = B1 + u; Where u; is assumed to be normally distributed with mean...
A: In simple linear regression the model contains a random dependent variable y and a hypothesized in...
Q: 5. Suppose that we draw a circle whose radius R is uniformly distributed on the interval (0, 1). Fin...
A: We have given that a circle whose radius R is uniformly distributed on the interval (0, 1). The pdf ...
Q: Researchers measured the data speeds for a particular smartphone carrier at 50 airports. The highest...
A:
Q: The expected value for the sum of draws is...
A: One hundred draws are going to be made with replacement from the box containing tickets -1, 0, 1, 1....
Q: While seafood consumption has health benefits as part of a well-diversified diet, the quality of the...
A:
Q: The following data are from a research study comparing two treatment conditions. Do the data indicat...
A:
Q: Suppose a surveyor wants to conduct a phone survey about a new song. She plans to take a simple rand...
A: The bias is the error that occur in the population. The information may taken from the sample but do...
Q: Students taking an online math Class find it harder to be successful than Students taking a seated m...
A: Given: Probability of success(p)=55%=0.55Number of trials(n)=12 Consider, X be the random variable t...
Q: The mean of 200 items is 48 and their Standard Deviation is 3. Find : (i) The sum of all the items, ...
A:
Q: Let X be a binomial random variable with a mean of 0.5 and a variance of 0.45. Find P(x is greater t...
A:
Q: proposed by an industrial engineer. To investigate the number of units assembled correctly with each...
A: In the given context, there are 3 treatments and 30 samples.
Q: Assuming boys and girls are equally likely, find the probability of a couple having a baby boy when ...
A: Given The data is as follows: Birth of boys and girls are equally likely.
Q: o If for two events, A and B P(B) = and P(A/B) Then find P(B A). 4 %3D -
A: here as per policy I have calculated first main question as all questions are totally different here...
Q: In a University of Minnesota study, 50 individuals with a rare cancer were followed for 24 months fr...
A: Given the follow up data of 50 individuals with a rare cancer for 24 months from date of diagnosis a...
Q: A EXAM #2 IE 3477 Methods and Industrial Engineering March 11, 2021 1. (20 points total) A guard rai...
A:
Q: of humD idenuly the values that are sighilicanly low, the values that are sign aner sighiicandy A te...
A:
Q: A jar contains 10 red marbles numbered 1 to 10 and 12 blue marbles numbered 1 to 12. A marble is dra...
A: Since you have posted a question with multiple sub-parts, we will solve first three subparts for you...
Q: Problem 15. Draw a histogram from the following data : Mid Value 15 25 35 45 55 65 75 Frequency 10 2...
A:
Q: researcher collected sample data for 16 women ages 18 to 24 . The sample had a mean serum cholest...
A:
Q: 1. For parts a-c, state whether X follows a binomial distribution. If X is binomial, give the values...
A: Given: Whether X follows the binomial distribution or not

Step by step
Solved in 2 steps with 2 images

- Construct index number of price from the following data byapplying: Marshall-Edgeworth’s methodand comment on the results. Commodity Price Quantty Price QuanttyA 2 8 4 6B 5 10 6 5C 4 14 5 10D 2 19 2 13Construct index number of price from the following data byapplying: a ) Laspeyre’s method Commodity Price Quantty Price QuanttyA 2 8 4 6B 5 10 6 5C 4 14 5 10D 2 19 2 13Construct index number of price from the following data byapplying: 1)Paasche’s method Commodity Price Quantty Price QuanttyA 2 8 4 6B 5 10 6 5C 4 14 5 10D 2 19 2 13
- The following table gives the prices of some food items in the base year and current year and the quantities sold in the base year and current year. Commodity 2000 2005 Price (K) Quantity Price (K) Quantity A B C 15 20 4 15 5 10 22 27 7 12 4 5 Compute the following price index numbers for 2005 from the above table: i. Laspeyre’s price index number ii. Paasche’s price index numberIOG Technologies offers semiconductor and system solutions for automotive industrial and multimarket sectors for applications in communication. The following data relates to the production of three products manufactured by them: Product Price (RM) Quantity 2000 2016 2000 2016 BD-1005 3.00 3.20 60 80 LCM-2134 2.00 2.50 100 90 DDK-456 3.50 4.00 500 700 Determine the Laspeyres Price Index (LPI) and Paasche Price Index (PPI) for 2016 using 2000 as the base period.The following data represent the concentration of organic carbon collected from mineral soil. (Data is already organized in ascending order … smallest to largest) 3.02 7 8.5 10.74 16.92 3.79 7.11 8.5 10.89 17.9 3.91 7.31 8.79 11.33 17.99 3.99 7.45 9.1 11.56 21 4.6 7.66 9.11 11.72 21.4 4.71 7.85 9.29 11.72 21.82 4.8 7.9 9.6 11.8 22.62 4.85 7.92 9.81 11.97 4.9 8.05 10.3 12.57 5.5 8.37 10.72 12.89 Compute the quartiles. Q1 is ____ (blank), Q2 is ____ (blank) , and Q3 is ____ (blank) Quartiles are data values that separate your data set into ____ (blank)equal parts. TRUE or FALSE Q2 is another name for the median
- The following data represent the concentration of organic carbon collected from mineral soil. (Data is already organized in ascending order … smallest to largest) 3.02 7 8.5 10.74 16.92 3.79 7.11 8.5 10.89 17.9 3.91 7.31 8.79 11.33 17.99 3.99 7.45 9.1 11.56 21 4.6 7.66 9.11 11.72 21.4 4.71 7.85 9.29 11.72 21.82 4.8 7.9 9.6 11.8 22.62 4.85 7.92 9.81 11.97 4.9 8.05 10.3 12.57 5.5 8.37 10.72 12.89 Using your calculator, find the mean and standard deviation. Round your mean and standard deviation to the nearest hundredths. The mean is ____ (blank) and the standard deviation is ____ (blank) Find the zscore for the data value 17.99. Round your answer to the nearest hundredths. The zscore is ____ (blank)The following data has been collected on the interarrival times of patients to an emergency department: 3.772, 1.761, 0.743, 15.988, 0.412, 7.541, 6.900, 3.447, 7.024, 1.061, 5.449, 0.309, 0.766, 4.807, 8.143, 0.093, 9.524, 0.012, 4.634, and 0.195 minutes. Estimate the squared coefficient of variation of the arrival process. Is the arrival process likely to be Poisson? Why or why not? Estimate the arrival rate?In the packaging department of a large aircraft parts distributor, a fairly reliable estimate ofpackaging and processing costs can be determined by knowing the weight of an order. Thus, theweight is a cost driver that accounts for a sizable fraction of the packaging and processing costsat this company. Data for the past 10 orders are given as follows:
- The prices and the numbers of various items produced by a small machine and stamping plant are reported below. Use 2010 as the base. 2010 2018 Item Price (in $) Quantity Price (in $) Quantity Washer 0.07 17,000 0.10 20,000 Cotter pin 0.04 125,000 0.03 130,000 Stove bolt 0.15 40,000 0.15 42,000 Hex nut 0.08 62,000 0.10 65,000 a. Determine the Laspeyres price index. (Round your answer to 2 decimal places.) b. Determine the Paasche price index. (Round your answer to 2 decimal places.)The data to the right contain the per-capita energy consumption, in kilowatt-hours, for each of the 20 provinces of a nation. Complete parts (a) through (c) below. 15,628 14,954 14,051 12,803 12,051 11,978 11,264 11,175 10,689 10,193 9,806 9,649 9,615 9,167 9,100 8,847 7,449 6,722 5,457 4,122 What percentage of these provinces has average per-capita energy consumption within ±1 standard deviation of the mean within ±2standard deviations of the mean, and within ±3 standard deviations of the mean? The percentage within ±1 standard deviation of the mean is __%Q3The following information was recorded in a toy store: Year 2016 Year 2017 Year 2018 Price Quantity Price Quantity Price Quantity Slime 6 50 9 60 10 56 Sticky tact 2 100 2 105 2 120 Stinky egg 4 60 4 50 6 60 Teddy Bear 10 30 11 26 12 24 Tortoise 8 40 11 39 12 36 Q3The following information was recorded in a toy store: (a) By using the above data, compute the Laspeyres Price Index for year 2018 by using year 2016 as base year. (b) Interpret your answer in part (a)). (c) By using the above data, compute the Paasche Price Index for year 2018 by using year 2016 as base year. (d) Which item has experienced the greatest inflation rate from year 2017 to year 2018? (Just state your answer, no calculation is needed in part (d)).


