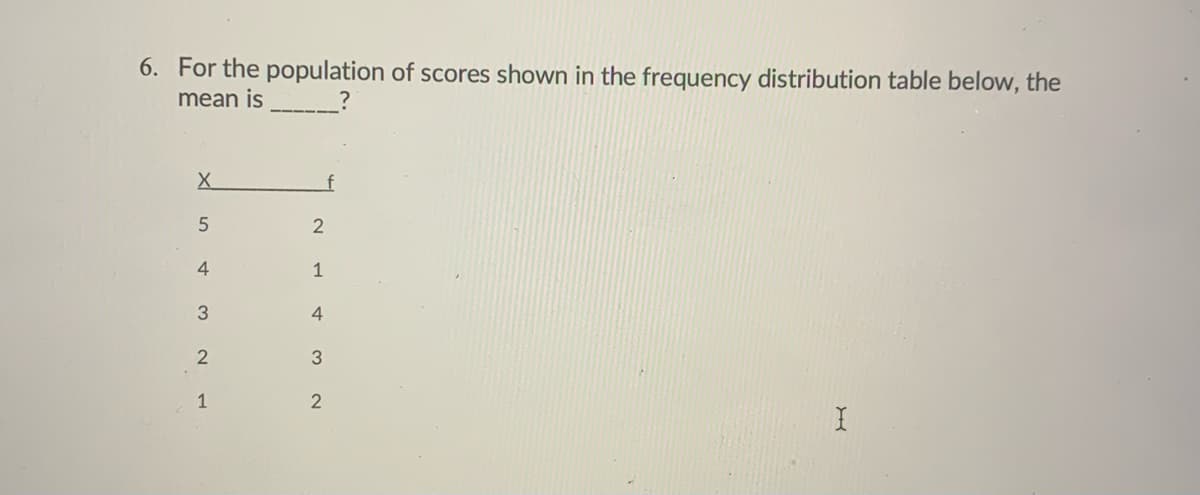
6. For the population of scores shown in the frequency distribution table below, the mean is 1 4. 1


Q: Suppose we want to know whether the mean of unemployment differs among the residents of two local…
A: Assume that the variance of unemployment in Community A is σ12 and the variance of unemployment in…
Q: Given that the mean of a set of data is 30 and the standard deviation is 4, what is the coefficient…
A: Coefficient of variation is used to measure the dispersion of observation from the mean. It is a…
Q: What is the mean for the population of scores shown in the frequency distribution table? x Y 5…
A: From the provided data we have,
Q: 1. Suppose you asked a sample of 12 correctional officers for the number of serious injuries they…
A:
Q: What is the mean for the population of scores presented in the frequency distribution table below?…
A: The given table shows the frequency distribution table of the scores.
Q: 16. Descibé thé shapé of the data distribution and the location of the mean in relation to the…
A: For the box plot Find the shape and location of mean relation to median
Q: 14. Describe the shape of the data distribution and the location of the mean in relation to the…
A: To write the shape and mean
Q: In a sample of n=6 scores, five of the scores are each one point above the mean. Where is the sixth…
A:
Q: What is the median for the population of scores shown in the frequency distribution table? X f 5…
A: Step 1: The frequency distribution table is, Step 2: Obtaining the cumulative frequencies…
Q: 12. What is the median for the population of scores shown in the frequency distribution table? f 1 3…
A:
Q: in a sample of n=6 five of the scores are above the mean by one point. where is the sixth score…
A: Let x be the mean, y be the sixth score and 5 scores are one point above the mean is 5(x+1).
Q: Use the following data to answer the next set of questions. Round your answers to the nearest Number…
A: Given that From this dot plot we get the data X = 30, 31, 31, 31, 32, 33, 33, 33, 33, 34, 34, 37,…
Q: 8. For a moderately skewed data, the arithmetic mean is 200, the coefficient of vatiation is 8 and…
A: Solution: 8. From the given information, arithmetic mean is 200, the coefficient of variation is 8…
Q: #2 Given the distribution Class f 1-9 8 10-18 16 19-27 10 28-36 14 37-45 12 Total 60 Find the (a)…
A: Given data is
Q: -32. Calculate Coefficient of Concurrent Deviations from the data given below : No. of Workers: 300…
A:
Q: 12. Below is a data set for number of toys a child owns in a particular neighborhood: ABCDEFG|H…
A: toatal no. of child N=8total number of toyes ∑xi =2+4+4+3+2+3+2+4=24
Q: If the shaded area corresponds to z=-0.90, what proportion of the distribution corresponds to z >…
A: We have given that the shaded area correspond to z = -0.90.
Q: 2. Sketch a histogram showing the distribution of scores shown in the following table: f 45-49 4…
A:
Q: A random sample of 15 college students were asked "How many hours per week typically do you work…
A: Given: n = 15 Formula Used: Mean = ∑Xin Median = n+12thterm
Q: For any distribution, what is the z-score corresponding to the median? a. 0 b. 1 c. N d. This is…
A: Correct option D. This is impossible to determine based on the information provided.
Q: What is the value of the Pearson coefficient of skewness for a distribution with a mean of 27,…
A:
Q: 2. The following frequency distribution depicts the marks received by 50 students in the Statistics…
A: The provided information is Class Frequency(f) Mid value (x) fx fx2 60-64 2 62 124 7688…
Q: 6. The following data gives the distribution of marks scored by a set of students. Find the mean and…
A:
Q: In a moderately skewed frequency distribution, the mean is 10 and its median is 9, if the…
A:
Q: d. What is the modal score of the given set of data? e. What is the standard deviation? f. Other…
A: Given that, The frequency distribution table as follows: Class Frequency 46-50 1 41-45 2…
Q: 15) If the population mean u of the data set is 2.09, what is the mean g of the sampling…
A:
Q: -of the data in a distribution is within 3 standa the mean? 66% 0% 50% 89%
A: Solution : According to the Chebyshev's theorem, (1-1/k^2) of the observation fall within k standard…
Q: 5. Use the following table to answer the questions asked. Rel. Freq. Cum Rel.Freg Score Frequency 89…
A: We have give the following table Note: According to Bartleby expert guidelines, we can answer only…
Q: Given a population of 5000 scores with mean µ = 86 and o=
A:
Q: 22) Suppose you have observations from six different regions within your state and you wish to do…
A:
Q: Calculate the mean of the grouped data from the given frequency distribution. Round your answer to…
A: Solution: Class Frequency(f) Midpoint (x) fx 40-49 2 44.5 89 50-59 5 54.5 272.5 60-69…
Q: 23. Refer to Exhibit 4. The standard error of the mean for the sample is a. 0.5000 b. 0.1800 c.…
A: It is given that Population mean = 9 Population SD = 0.18 Sample size n = 121
Q: Provided below are the sizes of 15 farms, in acres, randomly selected from the state of Oregon. The…
A:
Q: Which of the following statistics is not a measure of central tendency A. Mean B. Median C. Mode D.…
A: A representative observation of the central part of the data is known as measure of central…
Q: a. For samples of size sixty, what is the distribution of the sample mean? b. Is the answer to part…
A: here given random variable X is from population with mean 30 and standard deviation 5 here use…
Q: (D) If the population has a bell-shape distribution, what proportion of observations are smaller…
A: We have given that, Let X be a random variable from bell-shape distribution (Normal distribution)…
Q: If a distribution is normal with μ = 60 and σ = 15, what proportion of the scores fall between 60…
A: Obtain the standard z-score for the random variable X equals 60. The standard z-score for the random…
Q: What is the mode for the population of scores presented in the frequency distribution table below?…
A: Mode is the value from data set which occurred highest number of times. That is the value with…
Q: 1. Solve the problem Twenty families were interviewed, and the following numbers of dependent…
A: (a) From the data, the frequency for the number of children category 0 is 2 because 0 appear two…
Q: A set of N-8 scores has a mean of a 11. 16 points are added to one of the scores, what is the new…
A: Here we need to choose from the correct option.
Q: Fortune Magazine reported the earnings of the 33 largest industrial corporations in US way back in…
A: Since you have posted a question with multiple subparts, we will solve the first three complete…
Q: If a population has a mean of 12.8, what is the mean of the sampling distribution? A. less than…
A:
Q: 14. When a distribution is positively skewed, the relationship of the mean, median and mode from…
A: when a distribution is positively skewed, the relationship of the mean, median and mode is from left…
Q: A set of n-4 scores has a mean of u11. H8 points are subtracted from one of the scores, what is the…
A:
Q: If a population has a mean of 16.7, what is the mean of the sampling distribution? A. less than…
A:
Q: 2. The following is the distribution of the percentage of students belonging to a certain minority…
A: We have given that The percentage of students belonging to a certain minority group in 40 school…
Q: 10 The following table shows the frequency distribution of the number of children at a childcare…
A: As per our guidelines, we are allowed to answer three sub-parts : Given Data : Class Frequency…
Q: Given a set of normally distributed scores with the mean of 20.00 and SD of 5.00, what proportion of…
A: We are givenμ = 20, σ = 5a)We have to find P( 10 < x < 28 )
Q: suppose a distribution has Mean = 20, Median = 10, and SD = 15. Then, the value of coefficient of…
A: Given information- Mean, x-bar = 20 Median = 10 Standard deviation, s = 15 So, Coefficient of…


Trending now
This is a popular solution!

Step by step
Solved in 2 steps with 2 images
