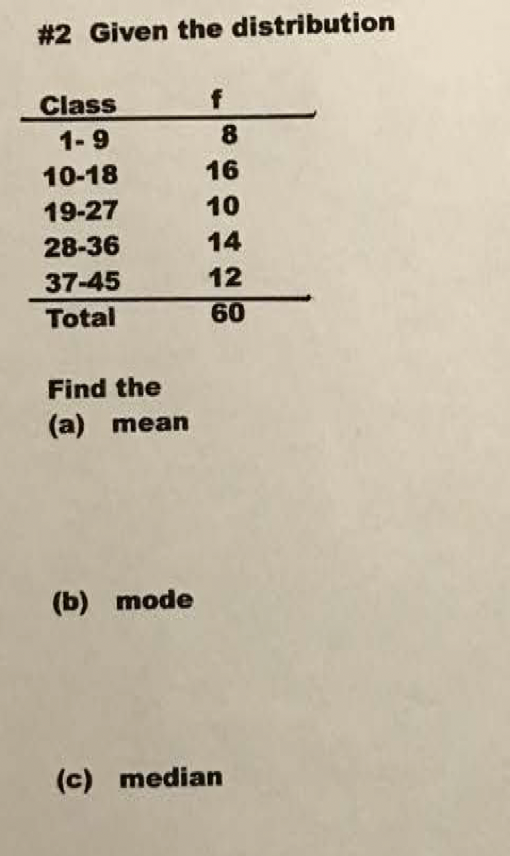
#2 Given the distribution Class f 1-9 8 10-18 16 19-27 10 28-36 14 37-45 12 Total 60 Find the (a) mean (b) mode (c) median


Q: Table 1 Profits Number of days (Dollars) 10-24 2 25-39 6. 40-54 8. 55-69 11 70-84 3 (i) State one…
A:
Q: Exhibit 1 Stem-and-leaf of Data: Amount of Money earned in a day in dollars Leaf Unit = 10 N = * 2…
A: Since you have posted a question with multiple sub-parts, we will solve first three subparts for…
Q: Example 3.3: Calculate the mean, median, and mode for the following data. Number of people Age 17 -…
A:
Q: 4. Find mean value of the given data. Scores Frequency (f) 41-45 36-40 8 31-35 26-30 14 21-25 16-20
A: Score and frequency are the given information, We have to form a table , Score Frequency (fi)…
Q: The mean of the distribution [3] The median of the distribution [4] The sample variance of the…
A: CI f cf x fx fx^2 10-24 2 2 17 34 578 25-39 6 8 32 192 6144 40-54 8 16 47 376 17672 55-69 11…
Q: Exhibit 1 Stem-and-leaf of Data: Amount of Money earned in a day in dollars Leaf Unit = 10 N = 2 59…
A: If the skewness is between -0.5 and 0.5, the data are fairly symmetrical. If the skewness is between…
Q: Exhibit 1 Stem-and-leaf of Data: Amount of Money earned in a day in dollars Leaf Unit 10 N = 59 3…
A: Note: Since you have posted a question with multiple sub-parts, we will solve first three sub-parts…
Q: What is the mean for the population of scores presented in the frequency distribution table below?…
A: The given table shows the frequency distribution table of the scores.
Q: Compute the standard scores for the batting averages of Cobb, Williams, and Brett to compare how far…
A: Given: Decade Mean sd Sample mean 1910 0.266 0.0371 0.42 1940 0.267 0.0326 0.406 1970…
Q: The following table shows the age distribution of persons in a particular region. Age (vears) Below…
A:
Q: Compute for the mean, median, mode, range, variance and standard deviation for the table below.…
A: Given: Class Interval f 70-72 2 67-69 2 64-66 4 61-63 5 58-60 11 55-57 8 52-54 4…
Q: The following table gives you the distribution of marks secured by some students in an examination :…
A:
Q: 2. Sketch a histogram showing the distribution of scores shown in the following table: f 45-49 4…
A:
Q: The following table shows the distribution of daily profits made by a local supermarket over a…
A: a) Class Interval Frequency, f Cumulative Frequency Mid-value, x fx x2 fx2 10-24 2 2 17 34 289…
Q: The following table shows the distribution of daily profits made by a local supermarket over a…
A: i) One disadvantage of displaying data in groups is that it becomes difficult to read and understand…
Q: Example 3 Calculate the mean of the given frequency distribution. Class intervals: 10-20 20-30 30-40…
A:
Q: 4. Consider the following frequency distribution below: Classes 11-21 22-32 19 33-43 31 44-54 39…
A:
Q: The following data provided are the average hours fifty-six grade 8 students spent doing their…
A: Range is the difference between largest and smallest observation. And variance is the measure of…
Q: b) The amount of money earned in a day by Ms. Anne's craft shop was recorded and displayed in the…
A: Note: Since you have posted a question with multiple sub-parts, we will solve first three sub-parts…
Q: Find the arithmetic mean and median
A: Since , frequency distribution is given below , Class interval Frequency 5-7 8 8-10 14…
Q: Find the mode of the following distribution: Class - interval: 0-10 10-20 20-30 30-40 40-50 50-60…
A:
Q: 2. The following frequency distribution depicts the marks received by 50 students in the Statistics…
A: The provided information is Class Frequency(f) Mid value (x) fx fx2 60-64 2 62 124 7688…
Q: The following table shows the distribution of daily profits made by a local supermarket over a…
A: Part (i): In a grouped frequency distribution one cannot see the exact values as the data is given…
Q: The following are the test scores obtained by 40 employees in a Satisfactory Assessment of a certain…
A: Find mean, median and mode
Q: 6. Find the mode and the median for the following distribution: Variable 0-5 5-10 10-15 15-20 20-25…
A:
Q: The following table shows the results of a survey of randomly selected residents of Mexico. Age 0-14…
A: Solve
Q: Calculate mean deviation from median and also its co-efficient for the following Example 4 frequency…
A:
Q: he classified age distribution of employees of a company is given in the following table. Age group…
A: Given : Data classified in age distribution of employees of a company . We need to compute the…
Q: 5.Consider the following frequency distribution below. Classes f…
A: From the given information, the required calculations can be done as follows: A=49 CI fi…
Q: Use the frequency distribution shown below to construct an expanded frequency distribution. High…
A: List of formulas : Midpoint = Lower limit of class + Upper limit of class2 Relative frequency =…
Q: 1. The scores obtained by 44 students in Grade 10 mathematics test are distributed as follows. Class…
A: To find the class boundaries and cumulative frequency of the given frequency table. Class Boundary:…
Q: When the mean, median and mode are of the same value the distribution should appear symmetric 50 40…
A:
Q: When the mean, median and mode are of the same value the distribution should appear symmetric 50 40…
A: We have given that, When the mean, median and mode are of the same value the distribution should…
Q: 4. Find mean value of the given data. Scores Frequency (f) 41-45 1 36-40 31-35 26-30 14 21-25 16-20
A: The table helps to find the mean value. Scores Frequency mid point fx 41-45 1 43 43 36-40 8…
Q: (i) State one disadvantage of displaying data in groups (ii) Use the table above to estimate the…
A: CI f cf x fx fx^2 9.5-24.5 2 2 17 34 578 24.5-39.5 6 8 32 192 6144 39.5-54.5 8 16 47 376 17672…
Q: % percent of households x 0 1 2 3 4 5 % 3 11 28 39 12 7 Compute the mean of the distribution 1.28…
A:
Q: 3. The following box plots show the distribution of test scores in MS. calculus. A period C period…
A: The given box plots show the distribution of test scores in Ms. Williams's two sections of calculus.
Q: What is the mode for the population of scores presented in the frequency distribution table below?…
A: Mode is the value from data set which occurred highest number of times. That is the value with…
Q: Example 2-2. Calculate the mean for the following frequency distribution : Class interval : 0-8 8–16…
A: Given data : Class Frequency 0 - 8 8 8 - 16 7 16 - 24 16 24 - 32 24 32 - 40 15 40 -…
Q: 5. Approximate the mean, median and the mode of the frequency distribution table below. CLASSES CM…
A: classes f CF mid-value(x) f.x -0.5-9.5 1 1 4.5 4.5 9.5-19.5 2 3 14.5 29 19.5-29.5 1 4…
Q: Real estate market cycles are commonly divided into four phases, Recovery (1), Expansion (II),…
A: The ranks for the four phases is given below: I Rank 1 II Rank 2 III Rank 3 IV Rank 4 -1.7 3.5…
Q: 75 39.0000| 10 en 40 De 717e N30 (a) Briefly describe the distribution of the daily sales (shape,…
A: As per our guidelines, we are allowed to answer first three sub-parts only. Thanks Given Histogram…
Q: 1. Find the measures of central tendency of frequency and standard deviation of the distribution…
A: Calculate Mean, Median, Mode, Population Standard deviation (σ), Sample Standard deviation (S) from…
Q: The following table shows the distribution of daily profits made by a local supermarket over a…
A: Main disadvantage of grouping data is the loss of information. The information for individual…
Q: Find the mean deviation about median for the followin distribution : x: 5 f: 9 11 13 15 17 2 4 6 8…
A:
Q: Exhibit 1 Stem-and-leaf of Data: Amount of Money earned in a day in dollars Leaf Unit = 10 N = * 2 2…
A: Stem-and-leaf data is given with leaf unit 10.
Q: 2. The following is the distribution of the percentage of students belonging to a certain minority…
A: We have given that The percentage of students belonging to a certain minority group in 40 school…
Q: : Calculate the coefficient of skewness for the follow- ing distribution : Central value : 1 2 3 4 6…
A: Given data is Central value 1 2 3 4 5 6 7 8 9 10 Frequency 2 9 11 14 20 24 20 16 5 5
Q: The following table shows the distribution of daily profits made by a local supermarket 30-day…
A: Disadvantage:- In grouped data we can't get accurate measures of central tendency, measure of…

Step by step
Solved in 4 steps with 5 images
