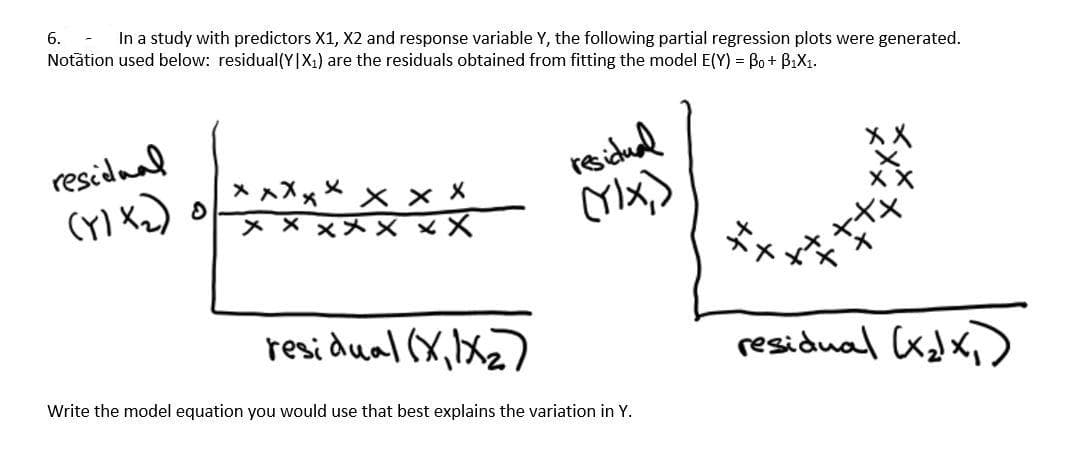
6. In a study with predictors X1, X2 and response variable Y, the following partial regression plots were generated. Notation used below: residual(Y|X₁) are the residuals obtained from fitting the model E(Y) = Bo + B₁X₁. residual (Y)X₂) D x xx xx xx x x xxxx xx residual (Y)X,) XX


Q: Test the claim that the proportion of men who own cats is smaller than the proportion of women who…
A: From the provided information,
Q: tistics released by a reputable traffic safety organization show that on an average weekend night, 1…
A:
Q: You are conducting a study to see if the probability of a true negative on a test for a certain…
A: According to the given information in this question We need to find test statistic and p value of…
Q: Researchers are trying to determine if there is a difference in the average lifespan of two species…
A: Given:Sample size (n1)=105Sample mean(x¯1)=51Sample standard deviation (s1)=7Sample size…
Q: Assume the returns from holding an asset are normally distributed. Also assume the average annual…
A: Given: μ = 0.163 σ = 0.335 Formula Used: "1-NORM.DIST(X, Mean, Standard deviation, True)"
Q: In a clinical trial of 734 subjects treated with medicine A, 29 reported headaches. In a control…
A: To calculate: The risk ratio
Q: A statistical test measures the experimental strength of evidence against the ____ hypothesis.
A: Null hypothesis: There is no sufficient evidence evidence in population parameter Alternative…
Q: Using ANOVA to compare the means of Remote, Hybrid, and Rural County fifth graders, what will be the…
A: Given, There are 3 groups being tested such as remote, hybrid and rural. There are 30 fifth students…
Q: Two random samples were taken from distinct populations. The sample from population one was of size…
A: The sample of 86 is drawn from population 1 and it contains 19 successes. i.e. n1=86, x1=19 X1 :…
Q: How does the normal curve allow behavioral scientists to compare different types of scales, tests…
A: First understand normal curve : For normal curve, the curve is bell-shaped and symmetrical. Zero…
Q: The researchers will conduct a test of significance at level a = 0.01 to test if these two species…
A: Given that researchers want to know if there is any significant difference between the life span of…
Q: Find the value of a such that P(Z > a) = 0.35 Round to two places after the decimal.
A: Z has a standard normal distribution P ( Z > a ) = 0.35
Q: find the z-scores that cut off a certain area you can use the invNorm function on the calculator.…
A: Z has a standard normal distribution. N(0,1) P(Z < a) = 0.4…
Q: A distributor receives a shipment of 60,000 porcelain figurines. The figurines are packed in 500…
A: It is essentially inferred that the sample mean (i.e., the mean number of damaged figurines in the…
Q: In a study of births in 2007, it was found that 51% were male and 49% were female. If 100 people are…
A: Given that there are 51% are male and 49% are female & if 100 people selected randomly we have…
Q: The cruising speed of the bullet train will be no less than 140 miles per hour. Use s to represent…
A: The cruising speed of the bullet train will be no less than 140 miles per hour. s be the train’s…
Q: A random variable X has a binomial distribution with = 0.34 and a sample size of n. Find the mean…
A:
Q: Occasionally students ask if I “grade on a curve”. By this they usually mean, do I add extra points…
A: Given Information: Mean score μ=84 Standard deviation σ=10 Top 10% of scores receive an A. The next…
Q: You wish to test the following claim (Ha) at a significance level of a = 0.01. Ηο: μ = 84.9 Ha: 84.9…
A: From the provided information, Sample size (n) = 45 Level of significance (α) = 0.01
Q: You are testing the claim that the proportion of men who own cats is larger than the proportion of…
A:
Q: Determine the minimum amount spent on eat-in orders by the top 5 percent of spenders on a particular…
A: Given that X~Normal ( μ = 11560 , σ = 284 ) X= The minimum amount spent on eat-in orders P( X >…
Q: Calculate the cancer specific mortality rate (per 1000): [
A: Here given, Vital statistics Total midyear population : 5,000,000 Number of live births : 5000…
Q: in a certain school distriet, it was observed that 35% of the students in the element schools were…
A: From the provided information, 35% of the students in the element schools were classified as only…
Q: Over a period of ten years, the number of times a certain individual has visited New York each year…
A:
Q: Using 2016 as the base year, calculate the Laspeyre’s Quantity Index for 2021.
A: Let p0 and q0 be the prices and quantities of base year i.e 2016 And p1 and q1 be the price and…
Q: Use the following data to answer question 8 - 12. A number of studies have claimed evidence that the…
A: From the provided information,
Q: A sport analyst wants to determine the mean salary of a Baseball player for 2015. He believes an…
A:
Q: You wish to test the following claim (H) at a significance level of a Ho: μ = 77.1 H :μ 7 77.1 You…
A: Given data: Significance level = 0.002 Let, X = 50.8 , 44, 50 Therefore, n = 3
Q: A clinical trial was conducted to test the effectiveness of a drug for treating insomnia in older…
A: Suppose µ is the mean wake time for a population with the treatment.
Q: A group of Economics students wish to know whether a student's spending is related to his/her…
A: Required: To identify the measure that indicates whether a student's spending is related to his/her…
Q: Calculate the cancer specific mortality rate (per 1000): [
A: Here from given statistics Death due to cancer = 100 Total midyear population = 5000000
Q: Exit polls, or interviews with voters right after they cast their ballots, are conducted by a…
A: P=P(Final selection winner)=0.60 n=25
Q: he New York Times ran an article about a study in which Johns Hopkins researchers subjected…
A: Given, For vinyl gloves : sample proportion (p1^) = 0.63 sample size (n1) = 240 For latex group…
Q: 6. Claim: P₁ > P₂; a = 0.01 Sample statistics: x₁=6,₁ 20 and x₂ = 4,n₂ = 30
A: Given: n1 = 20 X1 = 6 n2 = 30 X4 = 4 Formula Used: Test-statistic Z = p1^ - p2^P(1-P)1n1+1n2
Q: In a large population, about 45% of people prefer tea over coffee. A researcher takes a random…
A:
Q: Select all the answers that are associated with the p value Type I error alpha significance level…
A: P-value : P-value is a statistical measurement used to validate a hypothesis against a observed…
Q: Table 1.6 A biologist measured the width(in mm) of the upper molar in 40 specimens(population) of a…
A: Given, A biologist measured the width(in mm) of the upper molar in 40 specimens(population) of a…
Q: Z= Evaluate the following formula for P₁ = 0.9, P₂ = 0.6, P₁ P₂ = 0, p=0.294156, q=0.705844, n₁ =…
A: From the provided information,
Q: determine the proportion who smoke marijuana. It is observed that 150 smoke marijuana. Calculate a…
A: It is given that Favourable cases, X = 150 Sample size, n = 200 Sample proportion, p^ = X/n
Q: Draw the Venn and tree diagrams for the experiment of tossing a coin once.
A:
Q: Many investors and financial analysts believe the Dow Jones Industrial Average (DJIA) gives a good…
A: Given that n =76,x =21,P =0.3
Q: ) Find the expected value (mean) and the variance for the following distribution. Probability…
A: According to our guidelines, we can answer only first question. So, please repost the rest question.
Q: iii) P(-0.20 z-.50) 0.1122 O-0.1122 0.8878
A: Z-score is normally distributed with mean 0 and variance 1
Q: -cream sales is not indicative of substitution effect. B The Paasche’s indices are relatively…
A: The price and quantity of different flavors of Ice cream for the years 2016 and 2021 are given…
Q: 1. What is forecast? 2. When is qualitative methods of forecasting used? 3. When can quantitative…
A: Answer:
Q: What is the percentage of patients who recovered from diabetes in 2004? (b) What is the 90%, 95%…
A: HERE GIVEN , A study published in JAMA in 2004 examined past results of other studies on bariatric…
Q: Given the 1st and 3rd quartiles of a data are 24 and 48, respectively, what value would be…
A:
Q: Consider the density function f(x)= (a) Evaluate k. (b) Find F(x) and use it to evaluate P(0.5<…
A: There are two types of variables, they are discrete or continuous. Discrete variable are countable…
Q: The US vehicle sticker information states that you can expect 19 miles per gallon. It is desired to…
A: Note that this is a two-tailed test as the direction of alternative hypothesis is "not equal to".…
Q: An Izod impact test was performed on 20 specimens of PVC pipe. The sample mean is x = 1.41 and the…
A:

Step by step
Solved in 2 steps with 2 images

- Olympic Pole Vault The graph in Figure 7 indicates that in recent years the winning Olympic men’s pole vault height has fallen below the value predicted by the regression line in Example 2. This might have occurred because when the pole vault was a new event there was much room for improvement in vaulters’ performances, whereas now even the best training can produce only incremental advances. Let’s see whether concentrating on more recent results gives a better predictor of future records. (a) Use the data in Table 2 (page 176) to complete the table of winning pole vault heights shown in the margin. (Note that we are using x=0 to correspond to the year 1972, where this restricted data set begins.) (b) Find the regression line for the data in part ‚(a). (c) Plot the data and the regression line on the same axes. Does the regression line seem to provide a good model for the data? (d) What does the regression line predict as the winning pole vault height for the 2012 Olympics? Compare this predicted value to the actual 2012 winning height of 5.97 m, as described on page 177. Has this new regression line provided a better prediction than the line in Example 2?1. Suppose that the sales of a company (Y) is regressed on advertising expenditure (x) and labor cost (z), and the estimated regression equation is Y = 5 + 0.5x + 0.7z + u (where u is the error term). Here, sales, advertising expenditure and labor cost are measured in million Tk. Standard error for the coefficient of x is 0.4, standard error for the coefficient of z is 0.01, and the sample size is 20. Based on this information, find out whether labor cost is a statistically significant variable using an appropriate statistical test.A fitted linear regression model is (y=10+2x ). If x = 0 and the corresponding observed value of y = 9, the residual at this observation is:
- Suppose that the sales of a company (Y) is regressed on advertising expenditure (x) and labor cost (z), and the estimated regression equation is Y = 5 + 0.5x + 0.7z + u (where u is the error term). Here, sales, advertising expenditure and labor cost are measured in million Tk. Standard error for the coefficient of x is 0.04, standard error for the coefficient of z is 0.01, and the sample size is 20. Can we conclude that advertising expenditure is a statistically significant variable?I have some doubts regarding linear regression. if any 2 variables in X1, X2 AND Y have a positive correlation, then in the linear regression Y = b0 + b1X1 +b2X2 +e, will the sign of b1 and b2 both be positive? will the residuals that we get from linear regression will always be uncorrelated given X?17) Suppose that Y is normal and we have three explanatory unknowns which are also normal, and we have an independent random sample of 41 members of the population, where for each member, the value of Y as well as the values of the three explanatory unknowns were observed. The data is entered into a computer using linear regression software and the output summary tells us that R-square is 0.9, the linear model coefficient of the first explanatory unknown is 7 with standard error estimate 2.5, the coefficient for the second explanatory unknown is 11 with standard error 2, and the coefficient for the third explanatory unknown is 15 with standard error 4. The regression intercept is reported as 28. The sum of squares in regression (SSR) is reported as 90000 and the sum of squared errors (SSE) is 10000. From this information, what is the number of degrees of freedom for the t-distribution used to compute critical values for hypothesis tests and confidence intervals for the individual…
- In the example of First-Order Model in Five Quantitative Independent Variables, the parameters, βi,i=1,…,5, are often called partial regression coefficients. What does "partial" mean here?Consider a simple linear regression model with predictor variable x and response variable y, where the regression line is represented by the equation y = β0 + β1x. If β0 = -5 and β1 = 3, what is the predicted value of y for a given x = 4?Suppose that researchers are interested in determining the bi-annual salary of statisticians of different levels using their years of experience and their education level (M = bachelors, P = doctorate). They fit the following model to a dataset that includes these variables and, after performing the proper steps of multiple linear regression, the following multiple linear regression model is obtained: yˆ = 42308 + 323x1 + 213x2 + 301(x1*x2) where the variables are as follows: yˆ = predicted bi−annual salary in dollars, x1 = number of years of experiencex2= {1 if the education level is a doctorate 0 if the education level is a bachelors What is the predicted bi-annual salary in dollars of an employee with 5 years of experience and a bachelor’s degree?
- Suppose that researchers are interested in determining the bi-annual salary of statisticians of different levels using their years of experience and their education level (M = bachelors, P = doctorate). They fit the following model to a dataset that includes these variables and, after performing the proper steps of multiple linear regression, the following multiple linear regression model is obtained: yˆ = 42308 + 323x1 + 213x2 + 301(x1*x2) where the variables are as follows: yˆ = predicted bi−annual salary in dollars, x1 = number of years of experiencex2= {1 if the education level is a doctorate 0 if the education level is a bachelors What is the predicted bi-annual starting salary of an employee with a doctorate degree? (Someone with no work experience). $ What is the predicted bi-annual starting salary of an employee with a bachelor’s degree? (Someone with no work experience). $8)Suppose that Y is normal and we have three explanatory unknowns which are also normal, and we have an independent random sample of 11 members of the population, where for each member, the value of Y as well as the values of the three explanatory unknowns were observed. The data is entered into a computer using linear regression software and the output summary tells us that R-square is 0.86, the linear model coefficient of the first explanatory unknown is 7 with standard error estimate 2.5, the coefficient for the second explanatory unknown is 11 with standard error 2, and the coefficient for the third explanatory unknown is 15 with standard error 4. The regression intercept is reported as 28. The sum of squares in regression (SSR) is reported as 86000 and the sum of squared errors (SSE) is 14000. From this information, what is MSE/MST? .5000 NONE OF THE OTHERS .2000 .3000 .4000In a multiple regression problem involving two independent variables, if b1 is computed to be +2.0, it means that the relationship between X1 and Y is significant the estimated mean of Y increases by 2 units for each increase of 1 unit of X1, holding X2 constant. the estimated mean of Y increases by 2 units for each increase of 1 unit of X1, without regard to X2 the estimated mean of Y is 2 when X1 equals zero.