The researchers will conduct a test of significance at level a = 0.01 to test if these two species have different average lifespans. The P-value for this test of significance is Obetween 0.0005 and 0.001. between 0.001 and 0.002. C
The researchers will conduct a test of significance at level a = 0.01 to test if these two species have different average lifespans. The P-value for this test of significance is Obetween 0.0005 and 0.001. between 0.001 and 0.002. C

MATLAB: An Introduction with Applications
6th Edition
ISBN:9781119256830
Author:Amos Gilat
Publisher:Amos Gilat
Chapter1: Starting With Matlab
Section: Chapter Questions
Problem 1P

Related questions
Question
Help needed urgently please
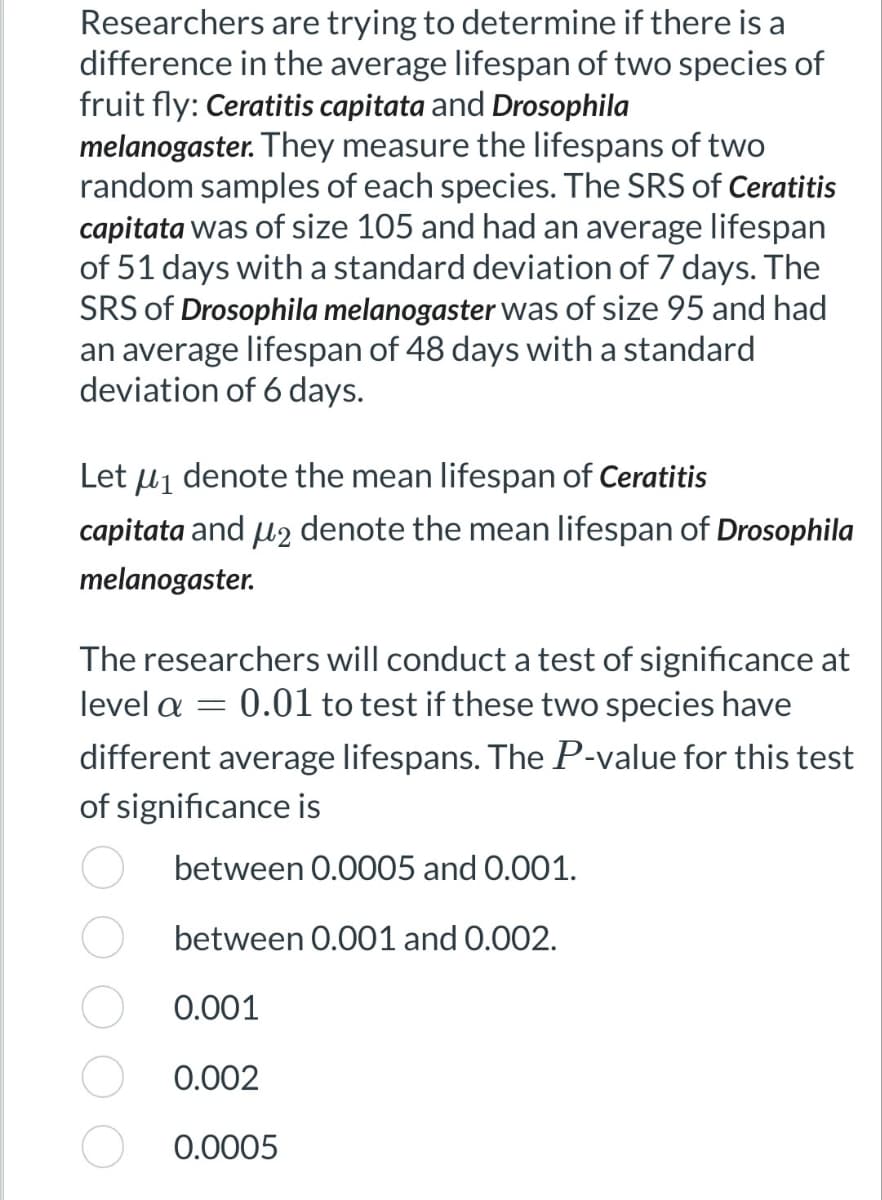
Transcribed Image Text:Researchers are trying to determine if there is a
difference in the average lifespan of two species of
fruit fly: Ceratitis capitata and Drosophila
melanogaster. They measure the lifespans of two
random samples of each species. The SRS of Ceratitis
capitata was of size 105 and had an average lifespan
of 51 days with a standard deviation of 7 days. The
SRS of Drosophila melanogaster was of size 95 and had
an average lifespan of 48 days with a standard
deviation of 6 days.
Let μ₁ denote the mean lifespan of Ceratitis
capitata and μ2 denote the mean lifespan of Drosophila
melanogaster.
The researchers will conduct a test of significance at
level a = 0.01 to test if these two species have
different average lifespans. The P-value for this test
of significance is
between 0.0005 and 0.001.
between 0.001 and 0.002.
0.001
0.002
0.0005
Expert Solution
This question has been solved!
Explore an expertly crafted, step-by-step solution for a thorough understanding of key concepts.

Step by step
Solved in 3 steps with 1 images

Recommended textbooks for you
MATLAB: An Introduction with Applications
Statistics
ISBN:
9781119256830
Author:
Amos Gilat
Publisher:
John Wiley & Sons Inc

Probability and Statistics for Engineering and th…
Statistics
ISBN:
9781305251809
Author:
Jay L. Devore
Publisher:
Cengage Learning

Statistics for The Behavioral Sciences (MindTap C…
Statistics
ISBN:
9781305504912
Author:
Frederick J Gravetter, Larry B. Wallnau
Publisher:
Cengage Learning
MATLAB: An Introduction with Applications
Statistics
ISBN:
9781119256830
Author:
Amos Gilat
Publisher:
John Wiley & Sons Inc
Probability and Statistics for Engineering and th…
Statistics
ISBN:
9781305251809
Author:
Jay L. Devore
Publisher:
Cengage Learning
Statistics for The Behavioral Sciences (MindTap C…
Statistics
ISBN:
9781305504912
Author:
Frederick J Gravetter, Larry B. Wallnau
Publisher:
Cengage Learning

Elementary Statistics: Picturing the World (7th E…
Statistics
ISBN:
9780134683416
Author:
Ron Larson, Betsy Farber
Publisher:
PEARSON

The Basic Practice of Statistics
Statistics
ISBN:
9781319042578
Author:
David S. Moore, William I. Notz, Michael A. Fligner
Publisher:
W. H. Freeman

Introduction to the Practice of Statistics
Statistics
ISBN:
9781319013387
Author:
David S. Moore, George P. McCabe, Bruce A. Craig
Publisher:
W. H. Freeman