6. Make a bar graph of the total amount of CO₂ produced for each different concentration of glucose. Make sure to label the axes and give the graph a title. Insert the graph here. 7. Make a line graph of the rate of cellular respiration for each different glucose concentration. Make sure to label the axes and give the graph a title. Insert the graph here.
6. Make a bar graph of the total amount of CO₂ produced for each different concentration of glucose. Make sure to label the axes and give the graph a title. Insert the graph here. 7. Make a line graph of the rate of cellular respiration for each different glucose concentration. Make sure to label the axes and give the graph a title. Insert the graph here.

Biomedical Instrumentation Systems
1st Edition
ISBN:9781133478294
Author:Chatterjee
Publisher:Chatterjee
Chapter6: Biomedical Electrodes, Sensors, And Transducers
Section: Chapter Questions
Problem 2P

Related questions

Question
See image
Transcribed Image Text:Glucose
Concentration
0%
1%
5%
10%
Amount of CO₂ produced in mm
10 min 20 min 30 min 40 min 50 min 60 min Total
0
1
3
2
0
2
7
4
0
3
10
5
0
5
12
7
0
6
15
8
0
7
17
9
0
7
17
9
2
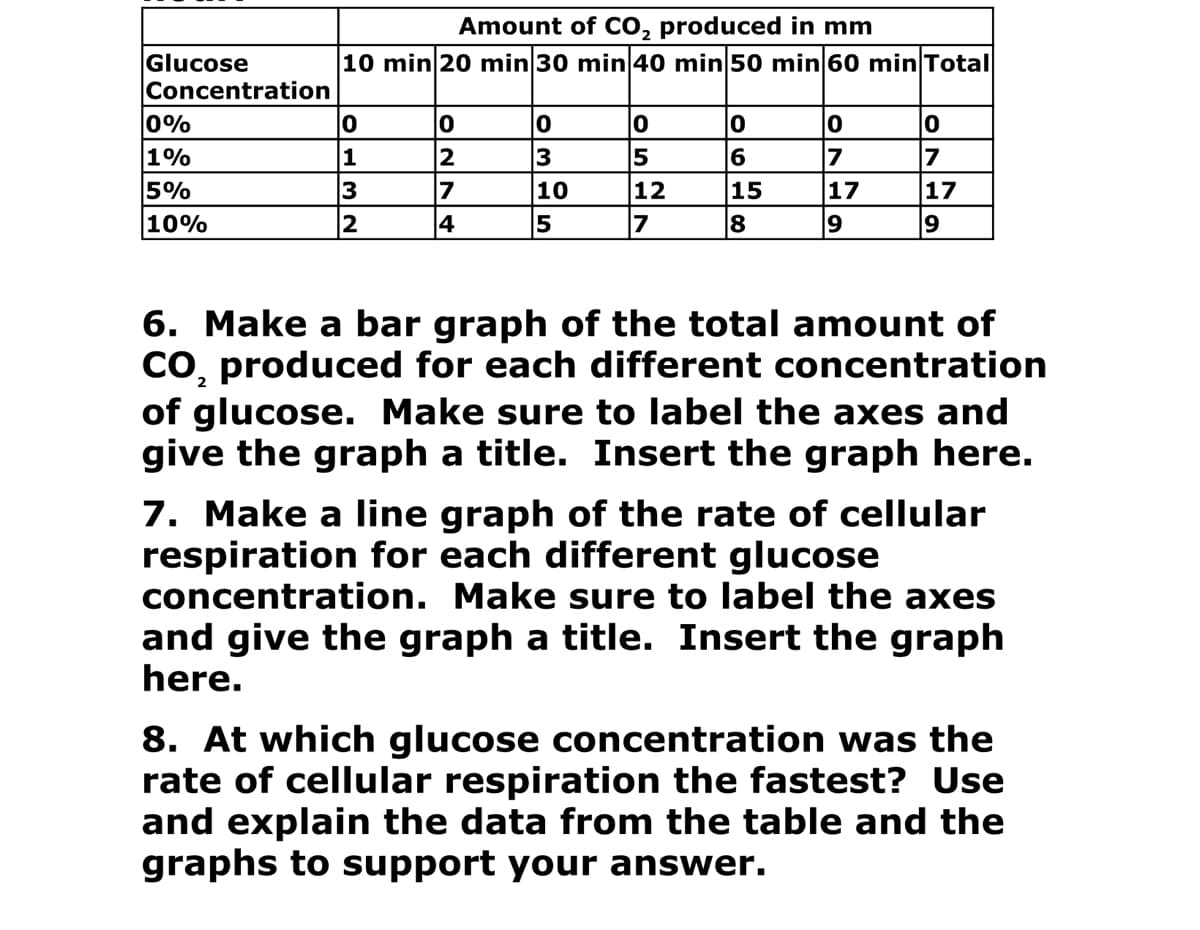
6. Make a bar graph of the total amount of
CO₂ produced for each different concentration
of glucose. Make sure to label the axes and
give the graph a title. Insert the graph here.
7. Make a line graph of the rate of cellular
respiration for each different glucose
concentration. Make sure to label the axes
and give the graph a title. Insert the graph
here.
8. At which glucose concentration was the
rate of cellular respiration the fastest? Use
and explain the data from the table and the
graphs to support your answer.
Expert Solution
This question has been solved!
Explore an expertly crafted, step-by-step solution for a thorough understanding of key concepts.

Step by step
Solved in 3 steps

Knowledge Booster


Learn more about
Need a deep-dive on the concept behind this application? Look no further. Learn more about this topic, biology and related others by exploring similar questions and additional content below.Recommended textbooks for you