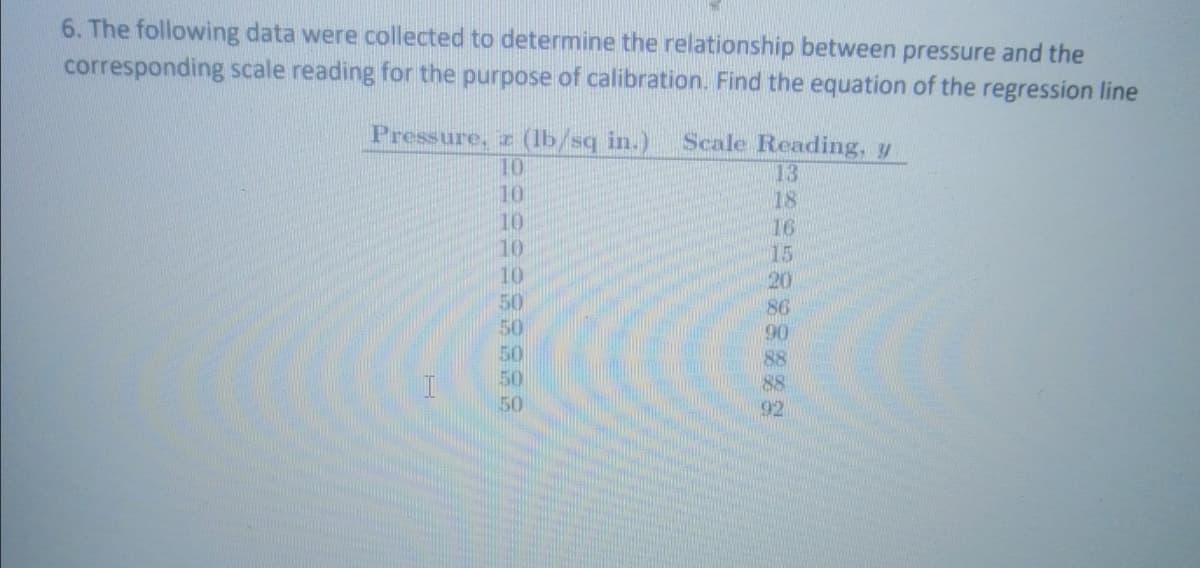
6. The following data were collected to determine the relationship between pressure and the corresponding scale reading for the purpose of calibration. Find the equation of the regression line Pressure, z (lb/sq in.) Scale Reading, y 13 18 16 10 10 10 10 15 20 50 50 86 50 50 50 92 8888883


Q: Below is some of the regression output from a regression of the amount rental houses on an island…
A: Question 29 The estimated equation is Price=1392+0.31*Size+1,987*View+0.05*Size*View. The predicted…
Q: Calculate the regression equation Y on X from the following data : Y 30 40 35 38 40 35 36 42 29 30
A: Given data is
Q: Based on the data shown below, calculate the regression line (each value to two decimal places) y…
A:
Q: Consider the following data points: r|-1 0 0 2 2 y-1 0 1 1 2 Find the best-fit line y = a+ Bx for…
A: note : As per our company guidelines we are supposed to answer ?️only the first question. Kindly…
Q: 6. The following data were collected to determine the relationship between pressure and the…
A: Solution r=1.00 Y=-1.70+1.81x
Q: Based on the data shown below, calculate the regression line (each value to two decimal places) y =…
A: Given data, X Y X*Y X*X 4 8 32 16 5 8.8 44 25 6 9.4 56.4 36 7 7.5 52.5 49 8 7.5 60 64…
Q: The following regression output is for predicting the heart weight (in g) of cats from their body…
A: Given, R2=64.66%=0.6466 Coefficient of determination that is R square is the square of correlation…
Q: Based on the data shown below, calculate the regression line (each value to two decimal places) y…
A:
Q: Based on the data shown below, calculate the regression line (each value to two decimal places)y = x…
A: Regression: Regression is a technique that is used to determine relationship between two or more…
Q: Below is some of the regression output from a regression of the amount rental houses on an island…
A: Given, Price=1474 + 0.31*Size + 1885*View + 0.1*(Size*View) View=1 if it has an ocean front view0…
Q: Use the given data to find the equation of the regression line. Round the final values to three…
A:
Q: Based on the data shown below, calculate the regression line (each value to two decimal places) y =…
A: Given data x y 1 6.36 2 3.82 3 6.28 4 5.64 5 4.3 6 7.06
Q: Based on the data below, calculate the regression line(each value to at least two decimal places) X…
A:
Q: The below data on the production volume x and total cost y (in dollars) for a particular…
A: (a) The estimated cost for the next month can simply be calculated by substituting x=650 in the…
Q: Q. 1. Plot the regression lines from the following information: Values of x = 1 3 4 5. Values of y =…
A:
Q: The following data gives (X-Temperature in F°) and the (y-Precipitation in inches). Find a) Find…
A:
Q: For the following data 2 5 10 12 15 14 15 (i) Find line of regression of Y on X (ii) Estimate Y for…
A:
Q: Q3. For 17 observations on Price (X) and Supply (Y), the following data were obtained in appropriate…
A:
Q: Consider the following data set. x 1 2 3 4 5 y 2.4 2 1.9 1.7 1.2 (a) Plot the data. (b)…
A: a. x 1 2 3 4 5 y 2.4 2 1.9 1.7 1.2
Q: Of the following pairs of values, X 3 | 4 5 | 6 7 8|9 Y 12 8 10 | 6 733 a) Determine the regression…
A: The least squares regression equation is given by: Y = a + bX Here, a is the intercept and b is the…
Q: Consider the following data on x = weight (pounds) and y = price (s) for 10 road-racing bikes. Brand…
A: Solution: Given information: n= 10 Observation k= 1 independent variable SSE= 6824137.81 Sum of…
Q: The following data were obtained on per-capita income (Y) in thousands of U.S. dollars and the…
A: Using Excel, we can perform regression analysis as follows: Enter data into the Excel spreadsheet…
Q: From the following data find the coefficient of correlation and obtain the two regression equations…
A:
Q: The following data were collected to determine the relationship between pressure and the…
A: Find Regression line equations from the following data X Y 10 13 10 18 10 16 10 15 10…
Q: 11.4 The following data ware colloctod to dotarmine the rolationship botwoon pressure and the…
A: The independent variable is Pressure. The dependent variable is Scale Reading. We have to find the…
Q: Cigarettes consumed per capita in 1930 (X) 530 1115 1145 510 380 Observation # Country Switzerland…
A:
Q: For the following set of data: X Y 2 1 7 10 5 8 3 3 4 4 13 a. Find the regression equation for…
A: As per guidelines we will solve first question only, please repost other questions for more answers.…
Q: 6. The following data were collected to determine the relationship between pressure and the…
A: To find the regression equation we will use Excel
Q: Based on the data shown below, calculate the regression line (each value to two decimal places) y =…
A:
Q: Run a regression analysis on the following data set, where y is the final grade in a math class and…
A: Given observation and calculation is shown below Hours/Week(x) Grade(y) x2 y2 xy 5 56 25 3136…
Q: Q- The grades of a class of 9 students on a midterm report (x) and on the final examination (y) are…
A: Given information: The grades of a class of 9 students on a midterm report (x) and on the final…
Q: The following data shows the height children with time: Age X, in (months) Height Y, in ( cm) 18 19…
A:
Q: Run a regression analysis on the following data set, where yy is the final grade in a math class and…
A: It was stated to run regression analysis on the following data set. y is the final grade in a math…
Q: For 10 observations on price (p) and supply (S) the following data were obtained (in appropriate…
A:
Q: For each of the following data sets: plot the data, determine the regression equation, and add the…
A:
Q: Based on the data shown below, calculate the regression line (each value to two decimal places) y =…
A: We have to find the regression line for the given data.
Q: Based on the data shown below, calculate the regression line (each value to two decimal places) y =…
A:
Q: Based on the data shown below, calculate the regression line (each value to two decimal places) y =…
A:
Q: Run a regression analysis on the following data set, where yy is the final grade in a math class and…
A: The variable x shows the hours and y shows the week grade.
Q: Please solve the following problem to fill in the blanks
A:
Q: Use the data given to solve the following problems. Savings needed for Health-Care Expenses During…
A: Given data: Age at Death Savings Needed 80 $219,000 85 $307,000 90 $409,000 95 $524,000…
Q: The following data are the monthly salaries y and the grade point averages x for students who…
A: Given data is GPA Monthly salary($) 2.6 3300 3.4 3600 3.6 4000 3.2 3500 3.5 3900 2.9…
Q: The following table shows the annual expenditures, in dollars, per customer unit for residential…
A: Given: The following table shows the annual expenditures, in dollars, per residential landline phone…
Q: Run a regression analysis on the following data set, where yy is the final grade in a math class and…
A: Regression: In order to obtain the least square regression line, first perform regression analysis…
Q: Run a regression analysis on the following data set, where yy is the final grade in a math class and…
A:
Q: Ms. Patsy Knowlet, a water quality engineer, noted that there seemed to be a close connection…
A: List of formulae : The confidence interval for slope of regression line is given by, CI = b1 ±…
Q: Run a regression analysis on the following data set, where yy is the final grade in a math class and…
A: It is given that y is the final grade in a math class and x is the average number of hours the…
Q: Q.4. Obtain the equation of the line of regression of y on x from the following data and estimate…
A: The value changes over a period time are used to predict the future value. It can be estimated using…
Q: The below data on the production volume x and total cost y (in dollars) for a particular…
A: Given information: Production volume Total cost 400 4000 450 5100 550 5400 600 6000 700…
Q: For the following scores, Y 4 2 9 1 6 1 9 a. Sketch a scatter plot and estimate the Pearson cor-…
A: We have given that two random variables X and Y each of sample size 4.


Trending now
This is a popular solution!

Step by step
Solved in 2 steps with 13 images

- The following fictitious table shows kryptonite price, in dollar per gram, t years after 2006. t= Years since 2006 0 1 2 3 4 5 6 7 8 9 10 K= Price 56 51 50 55 58 52 45 43 44 48 51 Make a quartic model of these data. Round the regression parameters to two decimal places.For the following exercises, use Table 4 which shows the percent of unemployed persons 25 years or older who are college graduates in a particular city, by year. Based on the set of data given in Table 5, calculate the regression line using a calculator or other technology tool, and determine the correlation coefficient. Round to three decimal places of accuracyFor the following exercises, consider the data in Table 5, which shows the percent of unemployed in a city ofpeople25 years or older who are college graduates is given below, by year. 41. Based on the set of data given in Table 7, calculatethe regression line using a calculator or othertechnology tool, and determine the correlationcoefficient to three decimal places.
- For the following exercises, consider the data in Table 5, which shows the percent of unemployed ina city of people 25 years or older who are college graduates is given below, by year. 40. Based on the set of data given in Table 6, calculate the regression line using a calculator or other technology tool, and determine the correlation coefficient to three decimal places.The following table shows the annual expenditures, in dollars, per customer unit for residential landline phone services and cellular phone services in the United States in the given year.† Year Landline Cell 2004 592 378 2006 542 524 2008 467 643 2010 401 760 Calculate the regression line for each type of service. (Let t be the time in years since 2004, L be the operating revenue of landline phone services and C be the expenditure of cellular services. Round your regression parameters to two decimal places.) L(t) = C(t) = Determine the expenditure level at which the two lines cross. Round your answer for the expenditure level to one decimal place. million dollarsA study of the amount of rainfall and the quantity of air pollution removed produced the following data shown in table below: Daily Rainfall x (0.01 cm) Particulate Removed y (μg/m3) 7 126 7.9 129.3 7.5 125.3 9.2 120.2 10.8 116.7 5.8 119.2 5.6 138.7 2.7 147.5 9.2 110.3 Plot a scatter diagram. Find the equation of the regression line to predict (y) for the particulate removed from the amount of daily rainfall.
- Run a regression analysis on the following data set, where yyis the final grade in a math class and xxis the average number of hours the student spent working on math each week. hours/weekxGradey445.6548661.4107710771284.81376.21699.41910020100 State the regression equation y=m⋅x+by=m⋅x+b, with constants accurate to two decimal places. What is the predicted value for the final grade when a student spends an average of 15 hours each week on math? Grade = Round to 1 decimal place.The following table gives the data for the grades on the midterm exam and the grades on the final exam. Determine the equation of the regression line, yˆ=b0+b1x�^=�0+�1�. Round the slope and y-intercept to the nearest thousandth. Grades on Midterm and Final Exams Grades on Midterm 7171 6262 7878 9494 8383 8181 8080 9494 8585 6262 Grades on Final 8888 7979 8888 9191 8080 7070 7171 9393 6565 7777Consider the following data set, where yy is the final grade in a math class and xx is the average number of hours the student spent working on math each week. hours/weekx Gradey 5 58 8 63.2 8 73.2 9 68.6 9 70.6 11 68.4 13 81.2 14 86.6 17 100 20 100 The regression equation is y=3.04⋅x+42.33y=3.04⋅x+42.33.Explain what the value of the slope means in this situation, where yy is the final grade in a math class and xx is the average number of hours the student spent working on math each week.Explain what the value of the y-intercept means in this situation.What is the predicted value for the final grade when a student spends an average of 15 hours each week on math?Grade = Round to 1 decimal place.
- Following is a portion of the computer output for a regression analysis relating y = maintenance expense (dollars per month) to x = usage (hours per week) of a particular brand of computer terminal. The regression equation is Y = 6.1092 + .8951 X Predictor Coef SE Coef Constant 6.1092 0.9361 X 0.8951 0.1490 Analysis of Variance SOURCE DF SS MS Regression 1 1575.76 1575.76 Residual Error 8 349.14 43.64 Total 9 1924.90 Complete the estimated regression equation (to 4 decimals). = + x Use a t test to determine whether monthly maintenance expense is related to usage at the .05 level of significance.Compute the value of the t test statistic (to 2 decimals). What is the p-value? Use Table 1 of Appendix B.Selectless than .01between .01 and .02between .02 and .05between .05 and .10between .10 and .20between .20 and .40greater than .40Item 4 What is your conclusion?SelectConclude that monthly maintenance expense is related to usageCannot conclude that…Following is a portion of the computer output for a regression analysis relating y = maintenance expense (dollars per month) to x = usage (hours per week) of a particular brand of computer terminal. The regression equation is Y = 6.1092 + .8951 X Predictor Coef SE Coef Constant 6.1092 0.9361 X 0.8951 0.1490 Analysis of Variance SOURCE DF SS MS Regression 1 1575.76 1575.76 Residual Error 8 349.14 43.64 Total 9 1924.90 Complete the estimated regression equation (to 4 decimals). = + x Use a t test to determine whether monthly maintenance expense is related to usage at the .05 level of significance.Compute the value of the t test statistic (to 2 decimals).What is the p-value? Use Table 1 of Appendix B.Selectless than .01between .01 and .02between .02 and .05between .05 and .10between .10 and .20between .20 and .40greater than .40Item 4What is your conclusion?SelectConclude that monthly maintenance expense is related to usageCannot conclude that…Consider the following regression equation representing the linear relationship between the Canada Child Benefit provided for a married couple with 3 children under the age of 6, based on their annual family net income: ŷ =121.09−0.57246xR2=0.894 where y = annual Canada Child Benefit paid (in $100s) x = net annual family income (in $1000s) Source: Canada Revenue Agency a. As the net annual family income increases, does the Canada Child Benefit paid increase or decrease? Based on this, is the correlation between the two variables positive or negative?The Canada Child Benefit paid .The correlation between the two variables is .b. Calculate the correlation coefficient and determine if the relationship between the two variables is strong, moderate or weak.r= , the relationship is . Round to 3 decimal places c. Interpret the value of the slope as it relates to this relationship. For every $1 increase in annual family net income, there is a $0.57246 decrease in…

