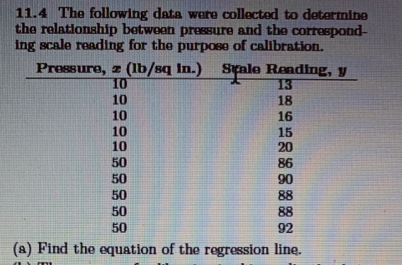
11.4 The following data ware colloctod to dotarmine the rolationship botwoon pressure and the correspond- ing scale reading for the purposo of calibration. Pressuro, z (lb/sq In.) Salo Randing, y 10 13 10 10 10 10 50 18 16 15 20 86 90 50 50 50 50 88 88 92 (a) Find the equation of the regression line.


Q: 3) The following data was collected regarding height and weight of a particular group. Height 70"…
A: For the given data ( a ) Develop scatter plot ( b ) Find regression equation ( c ) predict y when x…
Q: Given are five observations for two variables, and y. Excel File: data14-25.xlsx Xi Yi 2 7 The…
A: Given information: y^=7.6+0.9x x y y^ (y-y^)^2 2 7 7.6+(0.9*2)=9.4 5.76 6 18 13 25 9 9…
Q: 6. The following data were collected to determine the relationship between pressure and the…
A: Solution r=1.00 Y=-1.70+1.81x
Q: The following regression output is for predicting the heart weight (in g) of cats from their body…
A: Given, R2=64.66%=0.6466 Coefficient of determination that is R square is the square of correlation…
Q: Complete the missing information for this regression model. Note: N = 24. ]X3 Ý - 22.857 + 1.752X1…
A: a) The p-value for X1 is given by p-value = 0.1868Excel formula used: "=T.DIST.2T(1.367,20)"
Q: The following regression output is for predicting the heart weight (in g) of cats from their body…
A: From the output, the slope is 4.034 and the intercept is -0.357.
Q: Given are five observations for two variables, and y. Yi Use the estimated regression equation: ŷ=…
A: Hello! As you have posted more than 3 sub parts, we are answering the first 3 sub-parts. In case…
Q: Consider the following estimated regression for 220 home sales from a community in 2019 (estimated…
A: Please note that as per our guidelines if there are multiple sub-parts in a question we can answer…
Q: Use the given data to find the equation of the regression line. Examine the scatterplot and identify…
A:
Q: Isider the following estimated regression In Y, = 2.57 + 0.212 InKt + 0.343 InLt + 0.030 InWt (2.90)…
A: Q
Q: 6. The following data were collected to determine the relationship between pressure and the…
A: Solution-: Let, X=Pressure (lb/sq in.) and Y=Scale Reading We find the regression line Y on X
Q: The following data show the height h, in inches, and weight w, in pounds, of an average adult male.…
A:
Q: Consider the following data on x = weight (pounds) and y = price ($) for 10 road-racing bikes. Brand…
A:
Q: T isted below are sysdolic blood pressure measurements (in mm Hg) oblained trom the same woman Find…
A: Use EXCEL to construct the regression between the right arm and left arm. EXCEL procedure: Go to…
Q: Use the given data to find the equation of the regression line. Examine the scatterplot and identify…
A: We have given that, X :- 10, 3, 8, 7, 13, 11, 4, 6, 5, 12, 9 Y:- 15.89, 4.03, 14.15, 12.78,…
Q: udy was made on the amount of converted sugar in a certain process at various temperatures. The data…
A:
Q: Following is a portion of the computer output for a regression analysis relating y = maintenance…
A: 1. The value under the column “Coef” corresponding to the row “Constant” gives the intercept as…
Q: Consider the following data on x = weight (pounds) and y = price (s) for 10 road-racing bikes. Brand…
A: Solution: Given information: n= 10 Observation k= 1 independent variable SSE= 6824137.81 Sum of…
Q: The price X (dollars per pound) and consumption y (in pounds per capita) of beef were samples for 10…
A: Solution: From the given information, Then,
Q: The following data show the height h, in inches, and weight w, in pounds, of an average adult male.…
A: Let the power model for weight versus height be; w=ahbBy applying logarithm we can transfrom the…
Q: The following data were collected to determine the relationship between pressure and the…
A: Find Regression line equations from the following data X Y 10 13 10 18 10 16 10 15 10…
Q: The following estimated regression equation is based on 30 observations. ŷ = 18.5 + 3.7x1 – 2.2x2 +…
A: Solution
Q: Consider the following regression estimates (FNB) Source MS Number of obs 500 F(2, 497) Prob > F…
A: The formula for coefficient of determination or R-squared is, R2 = SSModel/SSTotal.
Q: The following variables X and Y are both ratio scores: Participant 3 21 4 8. 4. 1 6. 8. 5. 21 7. 4…
A: Since you have asked multiple parts, I am submitting the first 3 ques as per Bartleby guidelines.…
Q: Cigarettes consumed per capita in 1930 (X) 530 1115 1145 510 380 Observation # Country Switzerland…
A:
Q: The following results were obtained when each of a series of standard silver solutions was analyzed…
A: Hello! As you have posted more than 3 sub parts, we are answering the first 3 sub-parts. In case…
Q: Consider the following estimated regression for 220 home sales from a community in 2019 (estimated…
A: Given: n = 220 R square = 0.72
Q: 6. The following data were collected to determine the relationship between pressure and the…
A: To find the regression equation we will use Excel
Q: The output below estimates the following regression Treat; = Bo + B1 · Female; + e; Based on the…
A: As the regression coefficient corresponding to female is 0.0051549 which much lower. Also from P…
Q: The following data shows the height children with time: Age X, in (months) Height Y, in ( cm) 18 19…
A:
Q: The following information summarizes the linear relationship between size (in square feet) and…
A:
Q: The following regression output is for predicting the heart weight (in g) of cats from their body…
A: a) Linear model is y=-0.357+4.034*body weight where intercept = -0.357 slope = 4.034 b) Interpreting…
Q: The following data on the percentage of the high-performance radial tires made by a certain…
A: Given n=8
Q: Use the given data to find the equation of the regression line. Examine the scatterplot and identify…
A: Given that : By using regression analysis. X Y X \cdot YX⋅Y X^2X2 Y^2Y2 7 7.50 52.5 49…
Q: A factory estimated the relationship between the number of labor hours (Independent) and the number…
A:
Q: Consider the following regression output: Ît = 0.2033 +0.656Xt se (0.0976) (0.1961) r² = 0.397…
A:
Q: stats chp 14 (12)
A: Given data
Q: Use the given data to find the equation of the regression line. Examine the scatterplot and identify…
A: Given information: x y X^2 Y^2 XY 14 19.64 196 385.7296 274.96 8 15.5 64 240.25 124 10…
Q: Consider the following data on x = weight (pounds) and y = price ($) for 10 road-racing bikes.…
A: Given information SSE = 7,209,342.96 and SST = 50,969,800. SSR = 50,969,800 - 7,209,342.96 =…
Q: Consider the following regression estimates (XM3): 1,260 8.22 Linear regression Number of obs F(2,…
A: Solution
Q: 1. The following data is from a cylinder made out of a certain material with an unknown density.…
A: The linear regression technique uses a dataset to determine a linear function, y=ax+b such that the…
Q: The following estimated regression equation based on 10 observations was presented. ý = 27.1270 +…
A: The regression equation is, y-cap= 27.1270+0.5906x1+0.3980x2 a. The point estimate of the mean value…
Q: Consider the following regression output: Pt = 0.2033 + 0.656Xt se = (0.0976) (0.1961) r² = 0.397…
A: Given: The regression equation is: Yt^=0.2033+0.656Xt Where, β1=0.2033β2=0.656 n=19 Also,…
Q: Ms. Patsy Knowlet, a water quality engineer, noted that there seemed to be a close connection…
A: List of formulae : The confidence interval for slope of regression line is given by, CI = b1 ±…
Q: How do find the answer on paper and the TI84
A: Computation of regression line equation:Step-by-step procedure to find the regression line equation…
Q: Based on the data shown below, calculate the regression line (each value to two decimal places) y =…
A: Solution: The given data is
Q: For the following scores, Y 4 2 9 1 6 1 9 a. Sketch a scatter plot and estimate the Pearson cor-…
A: We have given that two random variables X and Y each of sample size 4.
Q: Following is a portion of the regression output for an application relating maintenance expense…
A: Answer is given below:
Show your complete solution.

Step by step
Solved in 2 steps with 1 images

- Find the equation of the regression line for the following data set. x 1 2 3 y 0 3 4The following fictitious table shows kryptonite price, in dollar per gram, t years after 2006. t= Years since 2006 0 1 2 3 4 5 6 7 8 9 10 K= Price 56 51 50 55 58 52 45 43 44 48 51 Make a quartic model of these data. Round the regression parameters to two decimal places.For the following exercises, use Table 4 which shows the percent of unemployed persons 25 years or older who are college graduates in a particular city, by year. Based on the set of data given in Table 5, calculate the regression line using a calculator or other technology tool, and determine the correlation coefficient. Round to three decimal places of accuracy
- Following is a portion of the computer output for a regression analysis relating y = maintenance expense (dollars per month) to x = usage (hours per week) of a particular brand of computer terminal. The regression equation is Y = 6.1092 + .8951 X Predictor Coef SE Coef Constant 6.1092 0.9361 X 0.8951 0.1490 Analysis of Variance SOURCE DF SS MS Regression 1 1575.76 1575.76 Residual Error 8 349.14 43.64 Total 9 1924.90 Complete the estimated regression equation (to 4 decimals). = + x Use a t test to determine whether monthly maintenance expense is related to usage at the .05 level of significance.Compute the value of the t test statistic (to 2 decimals). What is the p-value? Use Table 1 of Appendix B.Selectless than .01between .01 and .02between .02 and .05between .05 and .10between .10 and .20between .20 and .40greater than .40Item 4 What is your conclusion?SelectConclude that monthly maintenance expense is related to usageCannot conclude that…Following is a portion of the computer output for a regression analysis relating y = maintenance expense (dollars per month) to x = usage (hours per week) of a particular brand of computer terminal. The regression equation is Y = 6.1092 + .8951 X Predictor Coef SE Coef Constant 6.1092 0.9361 X 0.8951 0.1490 Analysis of Variance SOURCE DF SS MS Regression 1 1575.76 1575.76 Residual Error 8 349.14 43.64 Total 9 1924.90 Complete the estimated regression equation (to 4 decimals). = + x Use a t test to determine whether monthly maintenance expense is related to usage at the .05 level of significance.Compute the value of the t test statistic (to 2 decimals).What is the p-value? Use Table 1 of Appendix B.Selectless than .01between .01 and .02between .02 and .05between .05 and .10between .10 and .20between .20 and .40greater than .40Item 4What is your conclusion?SelectConclude that monthly maintenance expense is related to usageCannot conclude that…Consider the following data on x = weight (pounds) and y = price ($) for 10 road-racing bikes. These data provided the estimated regression equation ŷ = 28,240 − 1,419x. For these data, SSE = 7,209,342.96 and SST = 50,969,800. Use the F test to determine whether the weight for a bike and the price are related at the 0.05 level of significance. -Find the value of the test statistic. (Round your answer to two decimal places.)
- The following table shows the annual expenditures, in dollars, per customer unit for residential landline phone services and cellular phone services in the United States in the given year.† Year Landline Cell 2004 592 378 2006 542 524 2008 467 643 2010 401 760 Calculate the regression line for each type of service. (Let t be the time in years since 2004, L be the operating revenue of landline phone services and C be the expenditure of cellular services. Round your regression parameters to two decimal places.) L(t) = C(t) = Determine the expenditure level at which the two lines cross. Round your answer for the expenditure level to one decimal place. million dollarsWhich of the following best describes a regression coefficient in a bivariate setting? a. The change in Y predicted by a unit change in X b. The slope of a line that minimizes the sum of squared residuals c. The correlation coefficient multiplied by SDy/SDx d. All of the aboveConsider the following data set. x 1 2 3 4 5 y 2.2 2 1.9 1.6 1.1 Find the equation of the regression line. (Round the values to two decimal places.) y =
- The results of a sample of 7 data points are presented below in terms of the Average Daily Temperature (oF) and the Average Monthly Precipitation (inches): Average Daily temperature x 86 81 83 89 80 74 64 Average Monthly Precipitation y 3.4 1.8 3.5 3.6 3.7 1.5 0.2 d- Determine the regression line equation e- Plot the regression line on the scatter plot (on same graph) f- Calculate the standard error of estimate g- Find the 95% prediction interval for the 95oF average daily temperatureRun a regression analysis on the following data set, where yyis the final grade in a math class and xxis the average number of hours the student spent working on math each week. hours/weekxGradey445.6548661.4107710771284.81376.21699.41910020100 State the regression equation y=m⋅x+by=m⋅x+b, with constants accurate to two decimal places. What is the predicted value for the final grade when a student spends an average of 15 hours each week on math? Grade = Round to 1 decimal place.Consider the following computer output from a multiple regression analysis relating the price of a used car to the variables: age of car, mileage, and safety rating. Coefficients Coefficients Standard Error t� Stat P-value Intercept 38356.1138356.11 4686.294686.29 8.1858.185 0.00000.0000 Age (Year) −18219.29−18219.29 2196.312196.31 −8.295−8.295 0.00000.0000 Mileage(in Thousands) 1149.561149.56 1897.651897.65 0.6060.606 0.54720.5472 Safety Rating 1396.751396.75 159.64159.64 8.7498.749 0.00000.0000 Does the sign of the coefficient for the variable mileage make sense?
