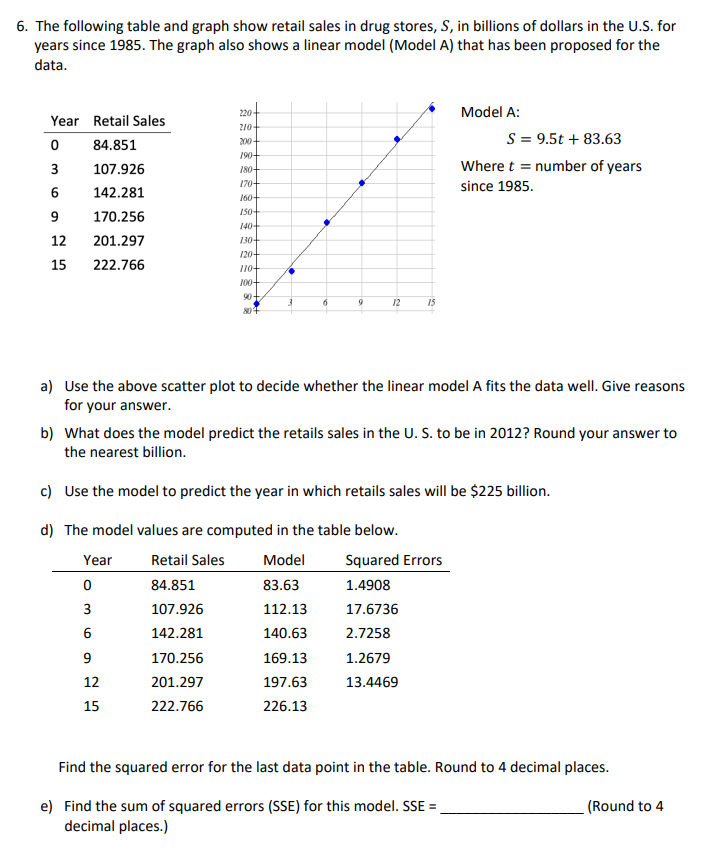
6. The following table and graph show retail sales in drug stores, S, in billions of dollars in the U.S. for years since 1985. The graph also shows a linear model (Model A) that has been proposed for the data. Year Retail Sales 0 84.851 3 107.926 6 142.281 9 170.256 12 201.297 15 222.766 220- 210 200 190- Year 0 3 6 180- 170+ 160- 9 12 15 150- 140- 130+ 120+ 110+ 100+ 804 9 12 15 a) Use the above scatter plot to decide whether the linear model A fits the data well. Give reasons for your answer. b) What does the model predict the retails sales in the U. S. to be in 2012? Round your answer to the nearest billion. c) Use the model to predict the year in which retails sales will be $225 billion. d) The model values are computed in the table below. Retail Sales Model 84.851 83.63 107.926 112.13 142.281 140.63 170.256 169.13 201.297 197.63 222.766 226.13 Model A: S = 9.5t + 83.63 Where t = number of years since 1985. Squared Errors 1.4908 17.6736 2.7258 1.2679 13.4469 Find the squared error for the last data point in the table. Round to 4 decimal places. e) Find the sum of squared errors (SSE) for this model. SSE = decimal places.) (Round to 4
6. The following table and graph show retail sales in drug stores, S, in billions of dollars in the U.S. for years since 1985. The graph also shows a linear model (Model A) that has been proposed for the data. Year Retail Sales 0 84.851 3 107.926 6 142.281 9 170.256 12 201.297 15 222.766 220- 210 200 190- Year 0 3 6 180- 170+ 160- 9 12 15 150- 140- 130+ 120+ 110+ 100+ 804 9 12 15 a) Use the above scatter plot to decide whether the linear model A fits the data well. Give reasons for your answer. b) What does the model predict the retails sales in the U. S. to be in 2012? Round your answer to the nearest billion. c) Use the model to predict the year in which retails sales will be $225 billion. d) The model values are computed in the table below. Retail Sales Model 84.851 83.63 107.926 112.13 142.281 140.63 170.256 169.13 201.297 197.63 222.766 226.13 Model A: S = 9.5t + 83.63 Where t = number of years since 1985. Squared Errors 1.4908 17.6736 2.7258 1.2679 13.4469 Find the squared error for the last data point in the table. Round to 4 decimal places. e) Find the sum of squared errors (SSE) for this model. SSE = decimal places.) (Round to 4

Algebra & Trigonometry with Analytic Geometry
13th Edition
ISBN:9781133382119
Author:Swokowski
Publisher:Swokowski
Chapter5: Inverse, Exponential, And Logarithmic Functions
Section5.3: The Natural Exponential Function
Problem 42E

Related questions
Question
Transcribed Image Text:6. The following table and graph show retail sales in drug stores, S, in billions of dollars in the U.S. for
years since 1985. The graph also shows a linear model (Model A) that has been proposed for the
data.
Year Retail Sales
84.851
107.926
142.281
170.256
201.297
222.766
0
3
6
9
12
15
Year
0
3
6
9
12 15
220-
210-
200
190
15
+081
170.256
201.297
222.766
170-
160-
150-
140-
130+
120-
110+
100+
90+
80+
6
9
a) Use the above scatter plot to decide whether the linear model A fits the data well. Give reasons
for your answer.
12
b) What does the model predict the retails sales in the U.S. to be in 2012? Round your answer to
the nearest billion.
c) Use the model to predict the year in which retails sales will be $225 billion.
d) The model values are computed in the table below.
Retail Sales Model
84.851
83.63
107.926
112.13
142.281
140.63
169.13
197.63
226.13
15
Model A:
S = 9.5t + 83.63
Where t = number of years
since 1985.
Squared Errors
1.4908
17.6736
2.7258
1.2679
13.4469
Find the squared error for the last data point in the table. Round to 4 decimal places.
e) Find the sum of squared errors (SSE) for this model. SSE =
decimal places.)
(Round to 4
Expert Solution
This question has been solved!
Explore an expertly crafted, step-by-step solution for a thorough understanding of key concepts.

This is a popular solution!

Trending now
This is a popular solution!

Step by step
Solved in 4 steps with 4 images

Recommended textbooks for you
Algebra & Trigonometry with Analytic Geometry
Algebra
ISBN:
9781133382119
Author:
Swokowski
Publisher:
Cengage
Algebra & Trigonometry with Analytic Geometry
Algebra
ISBN:
9781133382119
Author:
Swokowski
Publisher:
Cengage