MATLAB: An Introduction with Applications
6th Edition
ISBN: 9781119256830
Author: Amos Gilat
Publisher: John Wiley & Sons Inc
expand_more
expand_more
format_list_bulleted
Question

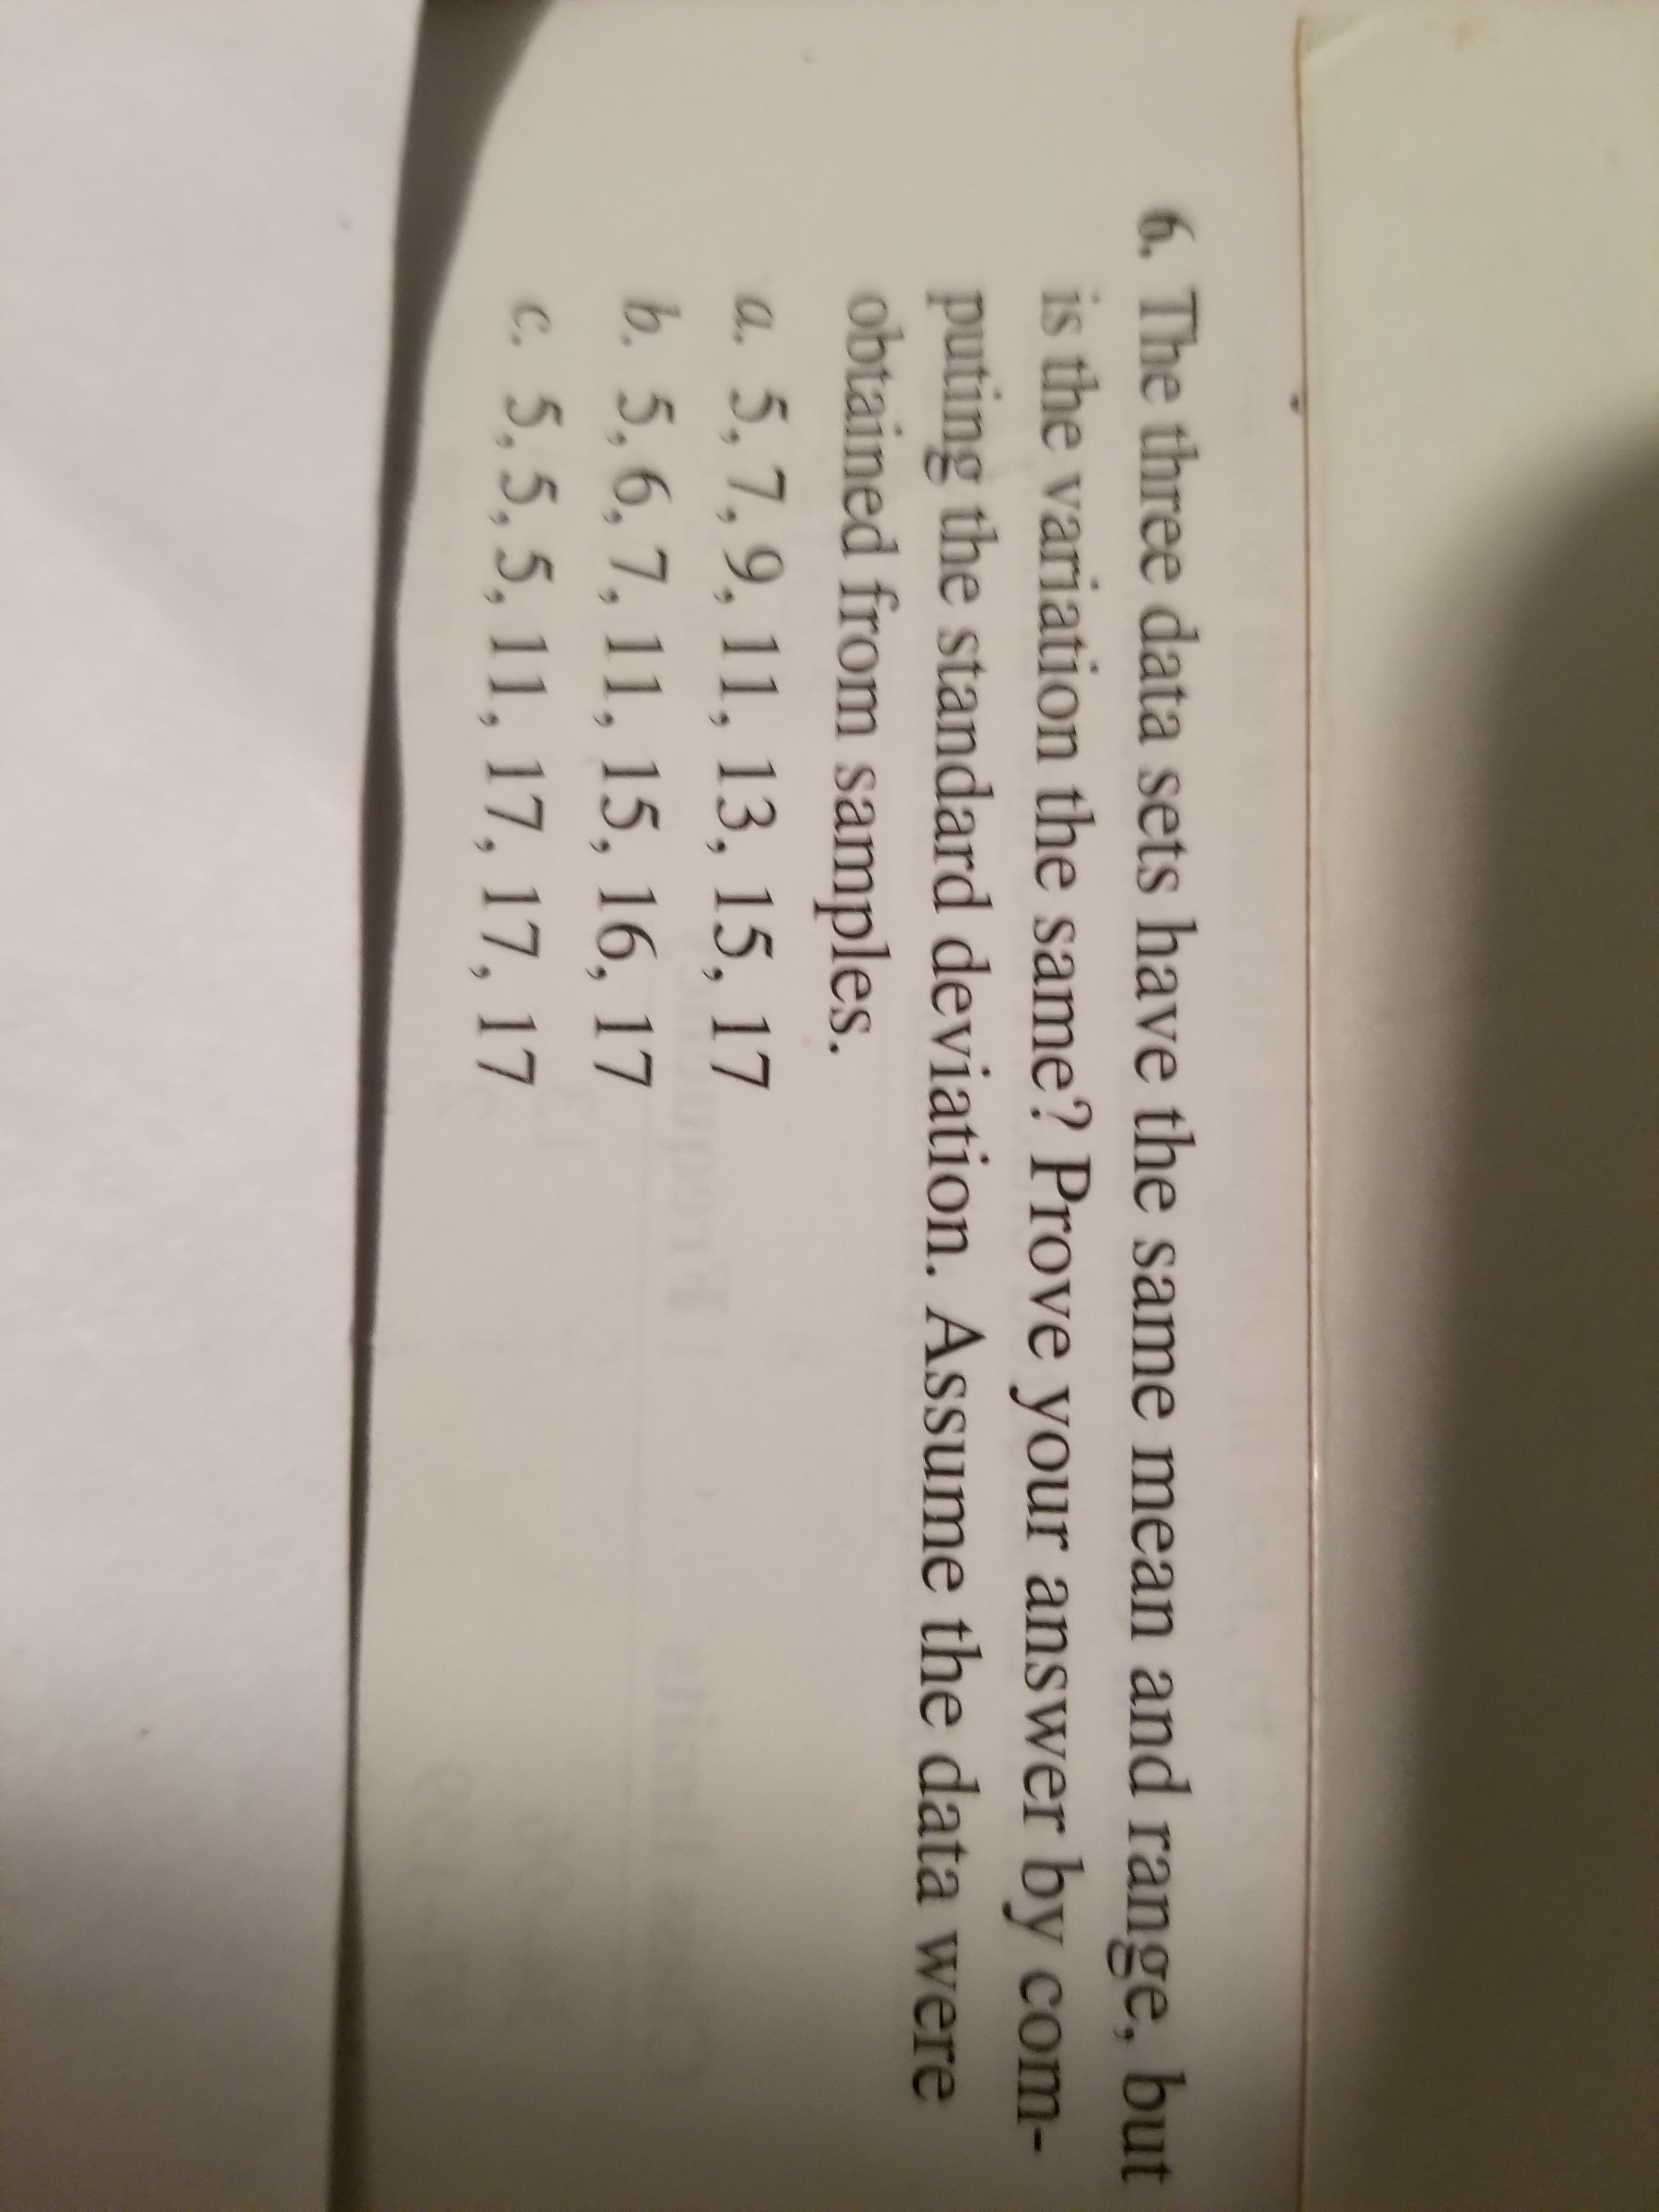
Transcribed Image Text:6. The three data sets have the same mean and range, but
is the variation the same? Prove your answer by com-
puting the standard deviation. Assume the data were
obtained from samples.
a. 5,7,9, 11, 13, 15, 17
b. 5, 6,7, 11, 15, 16, 17
c. 5,5, 5, 11,17, 17, 17
Expert Solution

This question has been solved!
Explore an expertly crafted, step-by-step solution for a thorough understanding of key concepts.
This is a popular solution
Trending nowThis is a popular solution!
Step by stepSolved in 4 steps with 3 images

Knowledge Booster
Similar questions
- A student scores 74 on a geography test and 264 on a mathematics test. The geography test has a mean of 80 and a standard deviation of 5. The mathematics test has a mean of 300 and a standard deviation of 24. If the data for both tests are normally distributed, on which test did the student score better relative to the other students in each class? OA. The student scored better on the mathematics test. OB. The student scored better on the geography test. OC. The student scored the same on both tests.arrow_forwardneed helparrow_forward1. Commute the range for baseball coaches yearly salaries. 2. Compute the mean yearly salary. 4. Compute the variance and the standard deviation for the yearly salary. Show you calculation. 4. Compute the coefficient of the variation.arrow_forward
- Calculate the range, variance , and stanard deviation for the following a.4,2,1,0,1 b.1,6,2,2,3,0,3 c.8,-2,1,3,5,4,4,1,3 d.0,2,0,0,-1,1,-2,1,0,-1,0,-3,-2,-1,0,1arrow_forwardSolve the following problem without using excelThat is, solve step by stepCalculate the mean median mode and standard deviation of the data 21,30, 27, 30, 25arrow_forwardFind the variance and the standard deviation for the following numbers: 1, 5, 6, 8. Show all your work. Do not simplify fractions/products/similar.arrow_forward
- Compare the population variance to the mean of the sample variances. Choose the correct answer below. A. The population variance is equal to the square root of the mean of the sample variances. B. The population variance is equal to the mean of the sample variances. C. The population variance is equal to the square of the mean of the sample variances.arrow_forward5. Determine the Range and Standard Deviation of the set of data below. 65, 70, 75, 80, 80, 85, 90, 90, 95, 100arrow_forwardCan someone help me out with these questions.arrow_forward
- Find the standard deviation.. Round to one more place than the data 7,19,20,8,17, 14, 8, 20, 12 O A. 5.1 O B. 1.7 O C. 5.4 O D. 5.7arrow_forward12. Stem and leaf Plot: (Sample )Variable: Gas $ Key: 12 = 1:2 1 : 2 2 : 3 : 4 : 5 : 55 6 : 7 : 88 8 : 9 12a. Use the above Stem and leaf plot and calculate the range. 12b. Use the above Stem and leaf plot and calculate the Quadratic Mean. 12c. Calculate the upper fence. 12d. Estimate the standard deviation.arrow_forwardThe 2004 Cincinnati Bengals scored 24, 16, 9, 17, 17, 23, 20, 26, 17, 14, 58, 27, and 28 points in their first 13 games. 2. Find the mean and the standard deviation of 3. Remove the lowest score from the data set. the data. Then find the mean and standard deviation of the new data. 4. How do the standard deviation and mean change when you remove the lowest number? Why do you think this is?arrow_forward
arrow_back_ios
arrow_forward_ios
Recommended textbooks for you
- MATLAB: An Introduction with ApplicationsStatisticsISBN:9781119256830Author:Amos GilatPublisher:John Wiley & Sons IncProbability and Statistics for Engineering and th...StatisticsISBN:9781305251809Author:Jay L. DevorePublisher:Cengage LearningStatistics for The Behavioral Sciences (MindTap C...StatisticsISBN:9781305504912Author:Frederick J Gravetter, Larry B. WallnauPublisher:Cengage Learning
- Elementary Statistics: Picturing the World (7th E...StatisticsISBN:9780134683416Author:Ron Larson, Betsy FarberPublisher:PEARSONThe Basic Practice of StatisticsStatisticsISBN:9781319042578Author:David S. Moore, William I. Notz, Michael A. FlignerPublisher:W. H. FreemanIntroduction to the Practice of StatisticsStatisticsISBN:9781319013387Author:David S. Moore, George P. McCabe, Bruce A. CraigPublisher:W. H. Freeman

MATLAB: An Introduction with Applications
Statistics
ISBN:9781119256830
Author:Amos Gilat
Publisher:John Wiley & Sons Inc

Probability and Statistics for Engineering and th...
Statistics
ISBN:9781305251809
Author:Jay L. Devore
Publisher:Cengage Learning

Statistics for The Behavioral Sciences (MindTap C...
Statistics
ISBN:9781305504912
Author:Frederick J Gravetter, Larry B. Wallnau
Publisher:Cengage Learning

Elementary Statistics: Picturing the World (7th E...
Statistics
ISBN:9780134683416
Author:Ron Larson, Betsy Farber
Publisher:PEARSON

The Basic Practice of Statistics
Statistics
ISBN:9781319042578
Author:David S. Moore, William I. Notz, Michael A. Fligner
Publisher:W. H. Freeman

Introduction to the Practice of Statistics
Statistics
ISBN:9781319013387
Author:David S. Moore, George P. McCabe, Bruce A. Craig
Publisher:W. H. Freeman