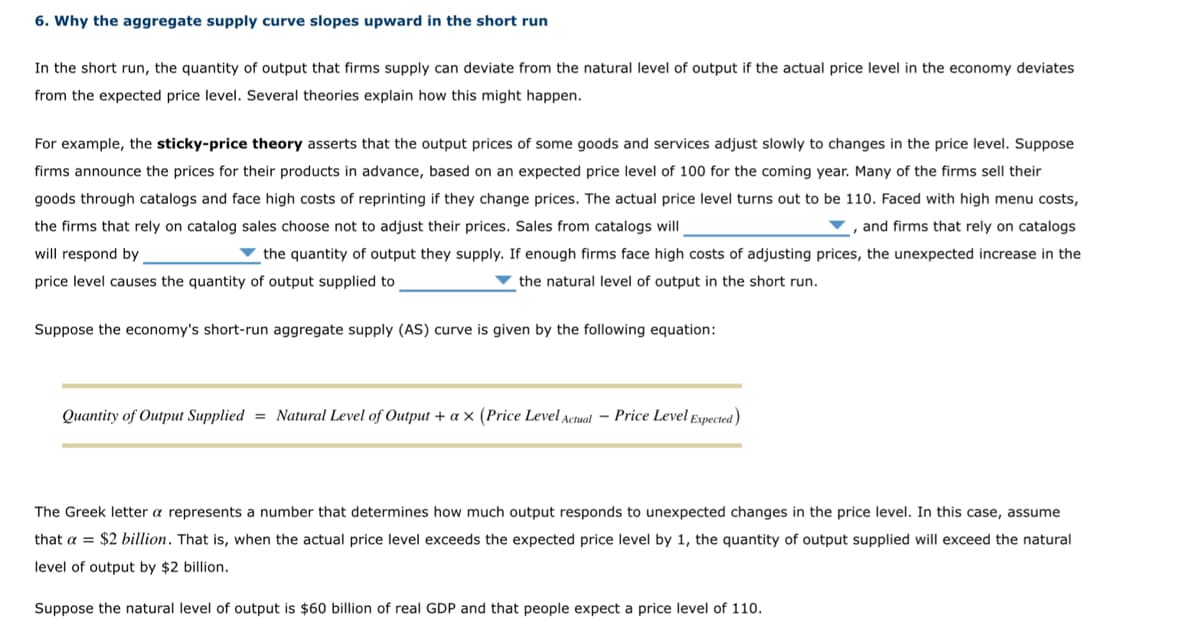
6. Why the aggregate supply curve slopes upward in the short run In the short run, the quantity of output that firms supply can deviate from the natural level of output if the actual price level in the economy deviates from the expected price level. Several theories explain how this might happen. For example, the sticky-price theory asserts that the output prices of some goods and services adjust slowly to changes in the price level. Suppose firms announce the prices for their products in advance, based on an expected price level of 100 for the coming year. Many of the firms sell their goods through catalogs and face high costs of reprinting if they change prices. The actual price level turns out to be 110. Faced with high menu costs, the firms that rely on catalog sales choose not to adjust their prices. Sales from catalogs will , and firms that rely on catalogs will respond by the quantity of output they supply. If enough firms face high costs of adjusting prices, the unexpected increase in the price level causes the quantity of output supplied to the natural level of output in the short run. Suppose the economy's short-run aggregate supply (AS) curve is given by the following equation: Quantity of Output Supplied = Natural Level of Output + ax (Price Level Actual-Price Level Expected) The Greek letter a represents a number that determines how much output responds to unexpected changes in the price level. In this case, assume that a = $2 billion. That is, when the actual price level exceeds the expected price level by 1, the quantity of output supplied will exceed the natural level of output by $2 billion. Suppose the natural level of output is $60 billion of real GDP and that people expect a price level of 110.
6. Why the aggregate supply curve slopes upward in the short run In the short run, the quantity of output that firms supply can deviate from the natural level of output if the actual price level in the economy deviates from the expected price level. Several theories explain how this might happen. For example, the sticky-price theory asserts that the output prices of some goods and services adjust slowly to changes in the price level. Suppose firms announce the prices for their products in advance, based on an expected price level of 100 for the coming year. Many of the firms sell their goods through catalogs and face high costs of reprinting if they change prices. The actual price level turns out to be 110. Faced with high menu costs, the firms that rely on catalog sales choose not to adjust their prices. Sales from catalogs will , and firms that rely on catalogs will respond by the quantity of output they supply. If enough firms face high costs of adjusting prices, the unexpected increase in the price level causes the quantity of output supplied to the natural level of output in the short run. Suppose the economy's short-run aggregate supply (AS) curve is given by the following equation: Quantity of Output Supplied = Natural Level of Output + ax (Price Level Actual-Price Level Expected) The Greek letter a represents a number that determines how much output responds to unexpected changes in the price level. In this case, assume that a = $2 billion. That is, when the actual price level exceeds the expected price level by 1, the quantity of output supplied will exceed the natural level of output by $2 billion. Suppose the natural level of output is $60 billion of real GDP and that people expect a price level of 110.

Brief Principles of Macroeconomics (MindTap Course List)
8th Edition
ISBN:9781337091985
Author:N. Gregory Mankiw
Publisher:N. Gregory Mankiw
Chapter15: Aggregate Demand And Aggregate Supply
Section: Chapter Questions
Problem 10PA

Related questions
Question
Transcribed Image Text:6. Why the aggregate supply curve slopes upward in the short run
In the short run, the quantity of output that firms supply can deviate from the natural level of output if the actual price level in the economy deviates
from the expected price level. Several theories explain how this might happen.
For example, the sticky-price theory asserts that the output prices of some goods and services adjust slowly to changes in the price level. Suppose
firms announce the prices for their products in advance, based on an expected price level of 100 for the coming year. Many of the firms sell their
goods through catalogs and face high costs of reprinting if they change prices. The actual price level turns out to be 110. Faced with high menu costs,
the firms that rely on catalog sales choose not to adjust their prices. Sales from catalogs will
, and firms that rely on catalogs
will respond by
the quantity of output they supply. If enough firms face high costs of adjusting prices, the unexpected increase in the
price level causes the quantity of output supplied to
the natural level of output in the short run.
Suppose the economy's short-run aggregate supply (AS) curve is given by the following equation:
Quantity of Output Supplied = Natural Level of Output + ax (Price Level Actual Price Level Expected)
The Greek letter a represents a number that determines how much output responds to unexpected changes in the price level. In this case, assume
that a $2 billion. That is, when the actual price level exceeds the expected price level by 1, the quantity of output supplied will exceed the natural
level of output by $2 billion.
Suppose the natural level of output is $60 billion of real GDP and that people expect a price level of 110.
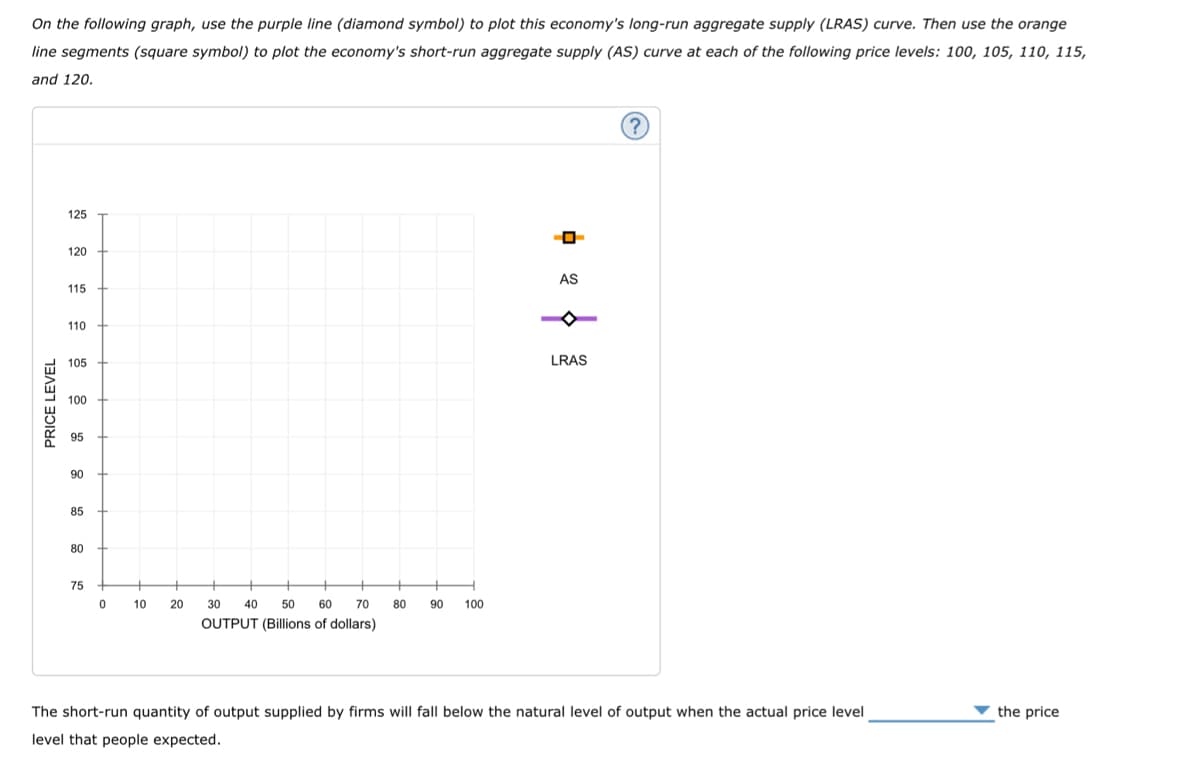
Transcribed Image Text:On the following graph, use the purple line (diamond symbol) to plot this economy's long-run aggregate supply (LRAS) curve. Then use the orange
line segments (square symbol) to plot the economy's short-run aggregate supply (AS) curve at each of the following price levels: 100, 105, 110, 115,
and 120.
(?
125
120
115
110
105
100
95
90
85
80
75
▼ the price
PRICE LEVEL
后备
20
AS
LRAS
0
10
80 90 100
30 40 50 60 70
OUTPUT (Billions of dollars)
The short-run quantity of output supplied by firms will fall below the natural level of output when the actual price level
level that people expected.
Expert Solution
This question has been solved!
Explore an expertly crafted, step-by-step solution for a thorough understanding of key concepts.

Step by step
Solved in 3 steps

Knowledge Booster


Learn more about
Need a deep-dive on the concept behind this application? Look no further. Learn more about this topic, economics and related others by exploring similar questions and additional content below.Recommended textbooks for you
Brief Principles of Macroeconomics (MindTap Cours…
Economics
ISBN:
9781337091985
Author:
N. Gregory Mankiw
Publisher:
Cengage Learning

Essentials of Economics (MindTap Course List)
Economics
ISBN:
9781337091992
Author:
N. Gregory Mankiw
Publisher:
Cengage Learning

Principles of Economics (MindTap Course List)
Economics
ISBN:
9781305585126
Author:
N. Gregory Mankiw
Publisher:
Cengage Learning
Brief Principles of Macroeconomics (MindTap Cours…
Economics
ISBN:
9781337091985
Author:
N. Gregory Mankiw
Publisher:
Cengage Learning
Essentials of Economics (MindTap Course List)
Economics
ISBN:
9781337091992
Author:
N. Gregory Mankiw
Publisher:
Cengage Learning
Principles of Economics (MindTap Course List)
Economics
ISBN:
9781305585126
Author:
N. Gregory Mankiw
Publisher:
Cengage Learning

Principles of Economics, 7th Edition (MindTap Cou…
Economics
ISBN:
9781285165875
Author:
N. Gregory Mankiw
Publisher:
Cengage Learning

Principles of Macroeconomics (MindTap Course List)
Economics
ISBN:
9781305971509
Author:
N. Gregory Mankiw
Publisher:
Cengage Learning

Principles of Macroeconomics (MindTap Course List)
Economics
ISBN:
9781285165912
Author:
N. Gregory Mankiw
Publisher:
Cengage Learning