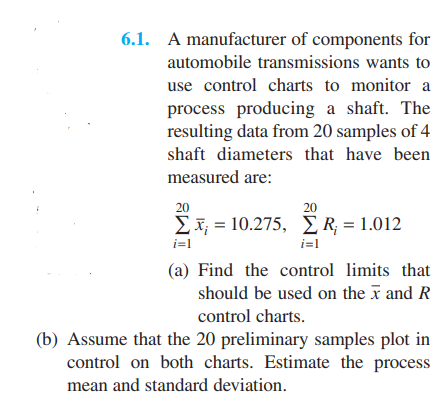
6.1. A manufacturer of components for automobile transmissions wants to use control charts to monitor a process producing a shaft. The resulting data from 20 samples of 4 shaft diameters that have been measured are: 20 20 ΣΣ-10.275, ΣR-1.012 i=1 i=l (a) Find the control limits that should be used on the x and R control charts. (b) Assume that the 20 preliminary samples plot in control on both charts. Estimate the process mean and standard deviation.
6.1. A manufacturer of components for automobile transmissions wants to use control charts to monitor a process producing a shaft. The resulting data from 20 samples of 4 shaft diameters that have been measured are: 20 20 ΣΣ-10.275, ΣR-1.012 i=1 i=l (a) Find the control limits that should be used on the x and R control charts. (b) Assume that the 20 preliminary samples plot in control on both charts. Estimate the process mean and standard deviation.

MATLAB: An Introduction with Applications
6th Edition
ISBN:9781119256830
Author:Amos Gilat
Publisher:Amos Gilat
Chapter1: Starting With Matlab
Section: Chapter Questions
Problem 1P

Related questions
Question
Please to perform in excel and show formulas.
Very important Note:
Please to perform in excel and show formulas. (Show pictures)
Please to perform in excel and show formulas. (Show pictures)
Note:
do not do it by hand
Transcribed Image Text:6.1. A manufacturer of components for
automobile transmissions wants to
use control charts to monitor a
process producing a shaft. The
resulting data from 20 samples of 4
shaft diameters that have been
measured are:
20
20
Σ-10.275, ΣR - 1.012
%3D
i=1
i=1
(a) Find the control limits that
should be used on the x and R
control charts.
(b) Assume that the 20 preliminary samples plot in
control on both charts. Estimate the process
mean and standard deviation.
Expert Solution
This question has been solved!
Explore an expertly crafted, step-by-step solution for a thorough understanding of key concepts.

This is a popular solution!

Trending now
This is a popular solution!

Step by step
Solved in 2 steps with 2 images

Recommended textbooks for you
MATLAB: An Introduction with Applications
Statistics
ISBN:
9781119256830
Author:
Amos Gilat
Publisher:
John Wiley & Sons Inc

Probability and Statistics for Engineering and th…
Statistics
ISBN:
9781305251809
Author:
Jay L. Devore
Publisher:
Cengage Learning

Statistics for The Behavioral Sciences (MindTap C…
Statistics
ISBN:
9781305504912
Author:
Frederick J Gravetter, Larry B. Wallnau
Publisher:
Cengage Learning
MATLAB: An Introduction with Applications
Statistics
ISBN:
9781119256830
Author:
Amos Gilat
Publisher:
John Wiley & Sons Inc
Probability and Statistics for Engineering and th…
Statistics
ISBN:
9781305251809
Author:
Jay L. Devore
Publisher:
Cengage Learning
Statistics for The Behavioral Sciences (MindTap C…
Statistics
ISBN:
9781305504912
Author:
Frederick J Gravetter, Larry B. Wallnau
Publisher:
Cengage Learning

Elementary Statistics: Picturing the World (7th E…
Statistics
ISBN:
9780134683416
Author:
Ron Larson, Betsy Farber
Publisher:
PEARSON

The Basic Practice of Statistics
Statistics
ISBN:
9781319042578
Author:
David S. Moore, William I. Notz, Michael A. Fligner
Publisher:
W. H. Freeman

Introduction to the Practice of Statistics
Statistics
ISBN:
9781319013387
Author:
David S. Moore, George P. McCabe, Bruce A. Craig
Publisher:
W. H. Freeman