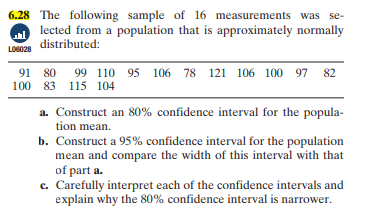
6.28 The following sample of 16 measurements was se- lected from a population that is approximately normally Loa distributed: LO28 91 80 99 110 95 106 78 121 106 100 97 82 100 83 115 104 a. Construct an 80% confidence interval for the popula- tion mean. b. Construct a 95% confidence interval for the population mean and compare the width of this interval with that of part a. c. Carefully interpret each of the confidence intervals and explain why the 80% confidence interval is narrower.
6.28 The following sample of 16 measurements was se- lected from a population that is approximately normally Loa distributed: LO28 91 80 99 110 95 106 78 121 106 100 97 82 100 83 115 104 a. Construct an 80% confidence interval for the popula- tion mean. b. Construct a 95% confidence interval for the population mean and compare the width of this interval with that of part a. c. Carefully interpret each of the confidence intervals and explain why the 80% confidence interval is narrower.

Glencoe Algebra 1, Student Edition, 9780079039897, 0079039898, 2018
18th Edition
ISBN:9780079039897
Author:Carter
Publisher:Carter
Chapter10: Statistics
Section10.4: Distributions Of Data
Problem 19PFA

Related questions
Question
100%
I'm stuck on this problem. Please write relevant explanations and draw any relevant graphs.
Transcribed Image Text:6.28 The following sample of 16 measurements was se-
lected from a population that is approximately normally
LOGO2e distributed:
91 80 99 110 95 106 78 121 106 100 97 82
100 83 115 104
a. Construct an 80% confidence interval for the popula-
tion mean.
b. Construct a 95% confidence interval for the population
mean and compare the width of this interval with that
of part a.
c. Carefully interpret each of the confidence intervals and
explain why the 80% confidence interval is narrower.
Expert Solution
This question has been solved!
Explore an expertly crafted, step-by-step solution for a thorough understanding of key concepts.

This is a popular solution!

Trending now
This is a popular solution!

Step by step
Solved in 4 steps

Knowledge Booster


Learn more about
Need a deep-dive on the concept behind this application? Look no further. Learn more about this topic, statistics and related others by exploring similar questions and additional content below.Recommended textbooks for you
Glencoe Algebra 1, Student Edition, 9780079039897…
Algebra
ISBN:
9780079039897
Author:
Carter
Publisher:
McGraw Hill
Glencoe Algebra 1, Student Edition, 9780079039897…
Algebra
ISBN:
9780079039897
Author:
Carter
Publisher:
McGraw Hill