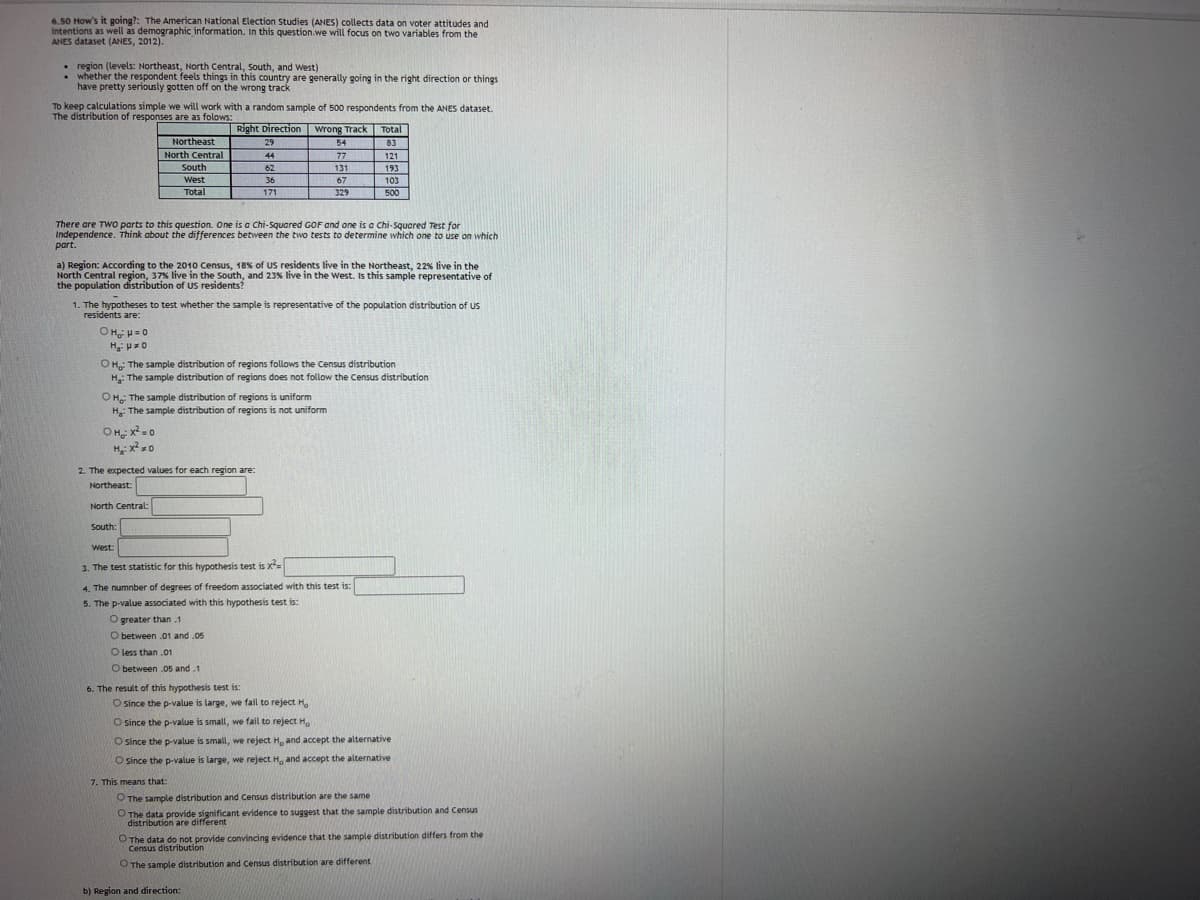
6.50 How's it going?: The American National Election Studies (ANES) collects data on voter attitudes and intentions as well as demographic information. In this question. we will focus on two variables from the ANES dataset (ANES, 2012). region (levels: Northeast, North Central, South, and west) whether the respondent feels things in this country are generally going in the right direction or things have pretty seriously gotten off on the wrong track To keep calculations simple we will work with a random sample of 500 respondents from the ANES dataset. The distribution of responses are as follows: Right Direction Wrong Track Total Northeast 29 54 83 44 77 121 North Central South 62 131 193 West 36 67 103 Total 171 329 500 There are TWO parts to this question. One is a Chi-Squared GOF and one is a Chi-Squared Test for Independence. Think about the differences between the two tests to determine which one to use on which part. a) Region: According to the 2010 Census, 18% of US residents live in the Northeast, 22% live in the North Central region, 37% live in the South, and 23% live in the West. Is this sample representative of the population distribution of US residents? 1. The hypotheses to test whether the sample is representative of the population distribution of US residents are: OH₂ μ = 0 H₂₂:μ*O OH,: The sample distribution of regions follows the Census distribution H₂: The sample distribution of regions does not follow the Census distribution OH: The sample distribution of regions is uniform H: The sample distribution of regions is not uniform OH: X²=0 H₂: x²0 2. The expected values for each region are: Northeast: North Central: South: West: 3. The test statistic for this hypothesis test is x²= 4. The number of degrees of freedom associated with this test is: 5. The p-value associated with this hypothesis test is: O greater than 1 O between .01 and .05 O less than .01 O between .05 and .1 6. The result of this hypothesis test is: O since the p-value is large, we fail to reject H O since the p-value is small, we fail to reject Ho O since the p-value is small, we reject H, and accept the alternative O since the p-value is large, we reject H, and accept the alternative 7. This means that: O The sample distribution and Census distribution are the same O The data provide significant evidence to suggest that the sample distribution and Census distribution are different O The data do not provide convincing evidence that the sample distribution differs from the Census distribution O The sample distribution and Census distribution are different b) Region and direction:
6.50 How's it going?: The American National Election Studies (ANES) collects data on voter attitudes and intentions as well as demographic information. In this question. we will focus on two variables from the ANES dataset (ANES, 2012). region (levels: Northeast, North Central, South, and west) whether the respondent feels things in this country are generally going in the right direction or things have pretty seriously gotten off on the wrong track To keep calculations simple we will work with a random sample of 500 respondents from the ANES dataset. The distribution of responses are as follows: Right Direction Wrong Track Total Northeast 29 54 83 44 77 121 North Central South 62 131 193 West 36 67 103 Total 171 329 500 There are TWO parts to this question. One is a Chi-Squared GOF and one is a Chi-Squared Test for Independence. Think about the differences between the two tests to determine which one to use on which part. a) Region: According to the 2010 Census, 18% of US residents live in the Northeast, 22% live in the North Central region, 37% live in the South, and 23% live in the West. Is this sample representative of the population distribution of US residents? 1. The hypotheses to test whether the sample is representative of the population distribution of US residents are: OH₂ μ = 0 H₂₂:μ*O OH,: The sample distribution of regions follows the Census distribution H₂: The sample distribution of regions does not follow the Census distribution OH: The sample distribution of regions is uniform H: The sample distribution of regions is not uniform OH: X²=0 H₂: x²0 2. The expected values for each region are: Northeast: North Central: South: West: 3. The test statistic for this hypothesis test is x²= 4. The number of degrees of freedom associated with this test is: 5. The p-value associated with this hypothesis test is: O greater than 1 O between .01 and .05 O less than .01 O between .05 and .1 6. The result of this hypothesis test is: O since the p-value is large, we fail to reject H O since the p-value is small, we fail to reject Ho O since the p-value is small, we reject H, and accept the alternative O since the p-value is large, we reject H, and accept the alternative 7. This means that: O The sample distribution and Census distribution are the same O The data provide significant evidence to suggest that the sample distribution and Census distribution are different O The data do not provide convincing evidence that the sample distribution differs from the Census distribution O The sample distribution and Census distribution are different b) Region and direction:

Glencoe Algebra 1, Student Edition, 9780079039897, 0079039898, 2018
18th Edition
ISBN:9780079039897
Author:Carter
Publisher:Carter
Chapter4: Equations Of Linear Functions
Section4.5: Correlation And Causation
Problem 11PPS

Related questions
Question
Transcribed Image Text:6.50 How's it going?: The American National Election Studies (ANES) collects data on voter attitudes and
intentions as well as demographic information. In this question we will focus on two variables from the
ANES dataset (ANES, 2012).
region (levels: Northeast, North Central, South, and West)
whether the respondent feels things in this country are generally going in the right direction or things
have pretty seriously gotten off on the wrong track
To keep calculations simple we will work with a random sample of 500 respondents from the ANES dataset.
The distribution of responses are as folows:
Right Direction Wrong Track Total
Northeast
29
54
83
North Central
44
77
121
South
62
131
193
West
36
67
103
Total
171
329
500
There are TWO parts to this question. One is a Chi-Squared GOF and one is a Chi-Squared Test for
Independence. Think about the differences between the two tests to determine which one to use on which
part.
a) Region: According to the 2010 Census, 18% of US residents live in the Northeast, 22% live in the
North Central region, 37% live in the South, and 23% live in the West. Is this sample representative of
the population distribution of US residents?
1. The hypotheses to test whether the sample is representative of the population distribution of US
residents are:
ⒸH₂ μ=0
H₂PO
OH: The sample distribution of regions follows the Census distribution
H₂: The sample distribution of regions does not follow the Census distribution
OH: The sample distribution of regions is uniform
H: The sample distribution of regions is not uniform
OH: X²=0
M₂: x²0
2. The expected values for each region are:
Northeast:
North Central:
South:
West:
3. The test statistic for this hypothesis test is x²
4. The number of degrees of freedom associated with this test is:
5. The p-value associated with this hypothesis test is:
O greater than 1
O between .01 and .05
O less than .01
O between .05 and .1
6. The result of this hypothesis test is:
O since the p-value is large, we fail to reject H
O since the p-value is small, we fail to reject Ho
O since the p-value is small, we reject H, and accept the alternative
O since the p-value is large, we reject H, and accept the alternative
7. This means that:
O The sample distribution and Census distribution are the same
O The data provide significant evidence to suggest that the sample distribution and Census
distribution are different
O The data do not provide convincing evidence that the sample distribution differs from the
Census distribution
O The sample distribution and Census distribution are different
b) Region and direction:
Expert Solution
This question has been solved!
Explore an expertly crafted, step-by-step solution for a thorough understanding of key concepts.

This is a popular solution!

Trending now
This is a popular solution!

Step by step
Solved in 2 steps with 1 images

Recommended textbooks for you
Glencoe Algebra 1, Student Edition, 9780079039897…
Algebra
ISBN:
9780079039897
Author:
Carter
Publisher:
McGraw Hill
Glencoe Algebra 1, Student Edition, 9780079039897…
Algebra
ISBN:
9780079039897
Author:
Carter
Publisher:
McGraw Hill