The manufacturer of Beanie Baby dolls used quarterly price data for 2012/-2020/V (t = 1, ..., 36) and the regression equation Pt= a + bt+c₁D1t+C2D2+ + c3D3t to forecast doll prices in the year 2021. Pt is the quarterly price of dolls, and D1, D2t, and D3+ are dummy variables for quarters I, II, and III, respectively. DEPENDENT VARIABLE: PT R-SQUARE P-VALUE ON F 0.0001 OBSERVATIONS: F-RATIO 76.34 STANDARD 36 0.9078 PARAMETER ESTIMATE 24.0 ERROR VARIABLE INTERCEPT T-RATIOP-VALUE 6.20 3.87 0.0005 T 0.8 0.240 3.33 0.0022 D1 -8.0 2.60 -3.08 0.0043 D2 -6.0 1.80 -3.33 0.0022 D3 -4.0 0.60 -6.67 0.0001 At the 2 percent level of statistical significance, is there a statistically significant trend in the price of dolls?
The manufacturer of Beanie Baby dolls used quarterly price data for 2012/-2020/V (t = 1, ..., 36) and the regression equation Pt= a + bt+c₁D1t+C2D2+ + c3D3t to forecast doll prices in the year 2021. Pt is the quarterly price of dolls, and D1, D2t, and D3+ are dummy variables for quarters I, II, and III, respectively. DEPENDENT VARIABLE: PT R-SQUARE P-VALUE ON F 0.0001 OBSERVATIONS: F-RATIO 76.34 STANDARD 36 0.9078 PARAMETER ESTIMATE 24.0 ERROR VARIABLE INTERCEPT T-RATIOP-VALUE 6.20 3.87 0.0005 T 0.8 0.240 3.33 0.0022 D1 -8.0 2.60 -3.08 0.0043 D2 -6.0 1.80 -3.33 0.0022 D3 -4.0 0.60 -6.67 0.0001 At the 2 percent level of statistical significance, is there a statistically significant trend in the price of dolls?

Big Ideas Math A Bridge To Success Algebra 1: Student Edition 2015
1st Edition
ISBN:9781680331141
Author:HOUGHTON MIFFLIN HARCOURT
Publisher:HOUGHTON MIFFLIN HARCOURT
Chapter4: Writing Linear Equations
Section: Chapter Questions
Problem 14CR

Related questions
Question
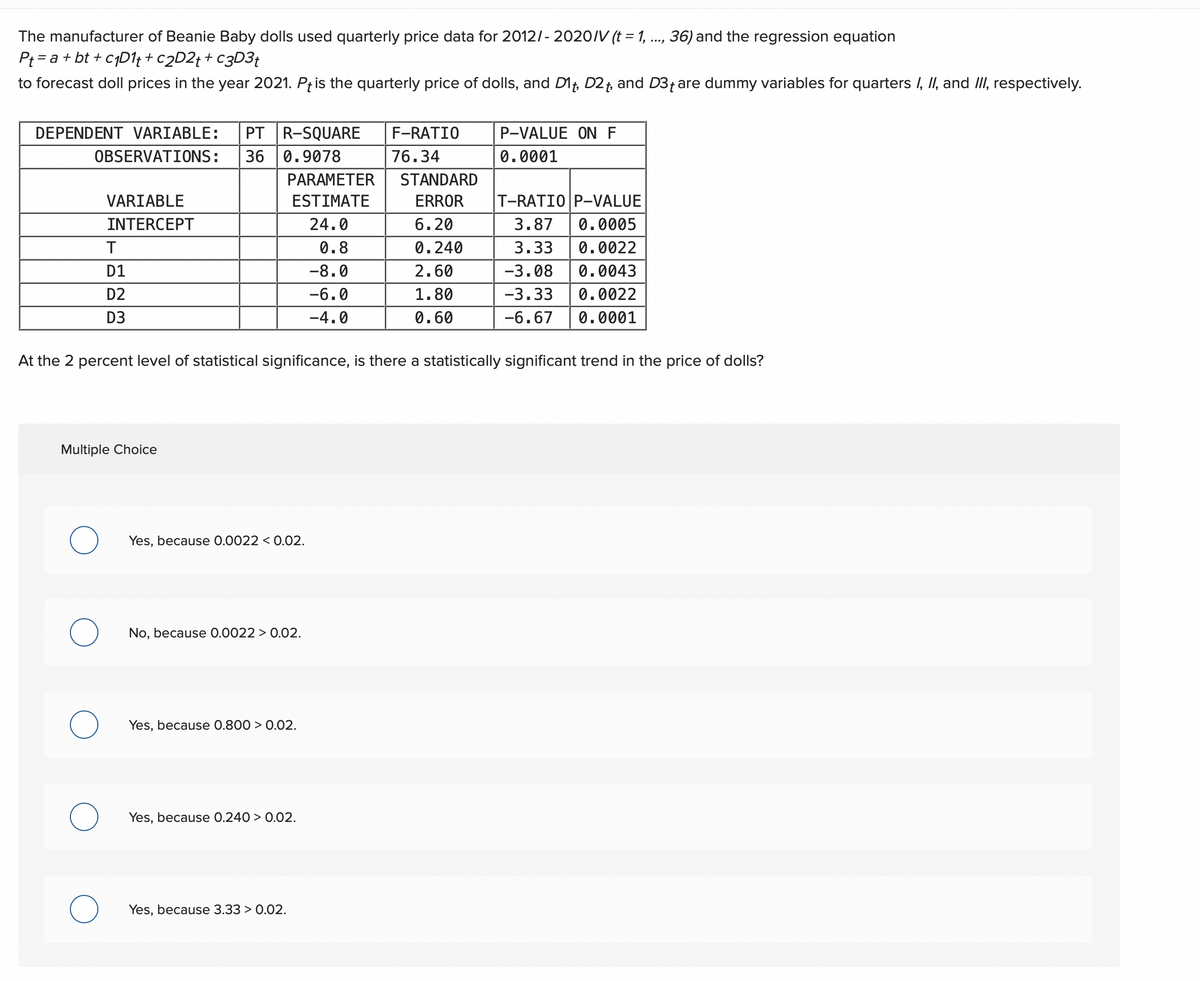
Transcribed Image Text:The manufacturer of Beanie Baby dolls used quarterly price data for 2012/- 2020/V (t = 1, ..., 36) and the regression equation
Pt= a + bt+c₁D1t + c2D2t + c3D3t
to forecast doll prices in the year 2021. Pt is the quarterly price of dolls, and D1, D2t, and D3+ are dummy variables for quarters I, II, and III, respectively.
DEPENDENT VARIABLE: PT R-SQUARE
P-VALUE ON F
0.0001
OBSERVATIONS:
F-RATIO
76.34
STANDARD
36 0.9078
PARAMETER
ESTIMATE
VARIABLE
ERROR
T-RATIOP-VALUE
INTERCEPT
24.0
6.20
3.87
0.0005
T
0.8
0.240
3.33
0.0022
D1
-8.0
2.60
-3.08 0.0043
D2
-6.0
1.80
-3.33
0.0022
D3
-4.0
0.60
-6.67 0.0001
At the 2 percent level of statistical significance, is there a statistically significant trend in the price of dolls?
Multiple Choice
Yes, because 0.0022 < 0.02.
No, because 0.0022 > 0.02.
Yes, because 0.800 > 0.02.
Yes, because 0.240 > 0.02.
Yes, because 3.33 > 0.02.
Expert Solution
This question has been solved!
Explore an expertly crafted, step-by-step solution for a thorough understanding of key concepts.

This is a popular solution!

Trending now
This is a popular solution!

Step by step
Solved in 2 steps

Recommended textbooks for you
Big Ideas Math A Bridge To Success Algebra 1: Stu…
Algebra
ISBN:
9781680331141
Author:
HOUGHTON MIFFLIN HARCOURT
Publisher:
Houghton Mifflin Harcourt
Big Ideas Math A Bridge To Success Algebra 1: Stu…
Algebra
ISBN:
9781680331141
Author:
HOUGHTON MIFFLIN HARCOURT
Publisher:
Houghton Mifflin Harcourt