6.61. One-pound coffee cans are filled by a machine, sealed, and then weighed automatically. After adjust- ing for the weight of the can, any package that weighs less than 16 oz is cut out of the conveyor. The weights of 25 successive cans are shown in Table 6E.20. Set up a moving range control chart and a control chart for individuals. Estimate the mean and standard devi- ation of the amount of coffee packed in each can. Is it reasonable to assume that can weight is normally distributed? If the process remains in control at this level, what percentage of cans will be underfilled?
6.61. One-pound coffee cans are filled by a machine, sealed, and then weighed automatically. After adjust- ing for the weight of the can, any package that weighs less than 16 oz is cut out of the conveyor. The weights of 25 successive cans are shown in Table 6E.20. Set up a moving range control chart and a control chart for individuals. Estimate the mean and standard devi- ation of the amount of coffee packed in each can. Is it reasonable to assume that can weight is normally distributed? If the process remains in control at this level, what percentage of cans will be underfilled?

Glencoe Algebra 1, Student Edition, 9780079039897, 0079039898, 2018
18th Edition
ISBN:9780079039897
Author:Carter
Publisher:Carter
Chapter10: Statistics
Section10.5: Comparing Sets Of Data
Problem 14PPS

Related questions
Question
if possible, solve it in excel and show the formulas
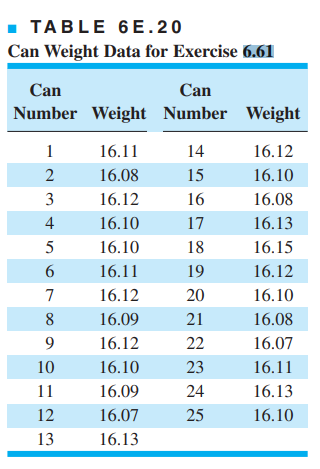
Transcribed Image Text:- TABLE 6E.20
Can Weight Data for Exercise 6.61
Can
Can
Number Weight Number Weight
1
16.11
14
16.12
16.08
15
16.10
16.12
16
16.08
16.10
17
16.13
16.10
18
16.15
16.11
19
16.12
16.12
20
16.10
16.09
21
16.08
16.12
22
16.07
10
16.10
23
16.11
11
16.09
24
16.13
16.07
25
16.10
16.13
2345 6 7 8 9 D =의으
Transcribed Image Text:6.61. One-pound coffee cans are filled by a machine,
sealed, and then weighed automatically. After adjust-
ing for the weight of the can, any package that weighs
less than 16 oz is cut out of the conveyor. The weights
of 25 successive cans are shown in Table 6E.20. Set
up a moving range control chart and a control chart
for individuals. Estimate the mean and standard devi-
ation of the amount of coffee packed in each can. Is
it reasonable to assume that can weight is normally
distributed? If the process remains in control at this
level, what percentage of cans will be underfilled?
Expert Solution
This question has been solved!
Explore an expertly crafted, step-by-step solution for a thorough understanding of key concepts.

This is a popular solution!

Trending now
This is a popular solution!

Step by step
Solved in 2 steps with 1 images

Recommended textbooks for you
Glencoe Algebra 1, Student Edition, 9780079039897…
Algebra
ISBN:
9780079039897
Author:
Carter
Publisher:
McGraw Hill
Glencoe Algebra 1, Student Edition, 9780079039897…
Algebra
ISBN:
9780079039897
Author:
Carter
Publisher:
McGraw Hill