The proportion of drivers who use seat belts depends on things like age (young people are more likely to go unbelted) and gender (women are more likely to use belts). It also depends on local law. In New York City, police can stop a driver who is not belted. In Boston at the time of the study, police could cite a driver for not wearing a seat belt only if the driver had been stopped for some other violation. Here are data from observing random samples of female Hispanic drivers in these two cities. (a) Verify that the 95% CI for the difference in the proportions of female Hispanic drivers in the two cities who wear seat belts pNY −pBT is (0.149,0.353). Show your computation. (b) Determine if the following statements are true or false, and explain your reasoning if you identify the statement as false. i. There was strong evidence that pNY > pBT. ii. 95% of random samples of 220 female Hispanic drivers in New York City and 117 female Hispanic drivers in Boston will yield differences in sample proportions between 14.9% and 35.3%. iii. A 90% confidence interval for pNY −pBT would be wider. iv. A 95% confidence interval for pBT −pNY is (−0.353,−0.149).
The proportion of drivers who use seat belts depends on things like age (young people are more likely to go unbelted) and gender (women are more likely to use belts). It also depends on local law. In New York City, police can stop a driver who is not belted. In Boston at the time of the study, police could cite a driver for not wearing a seat belt only if the driver had been stopped for some other violation. Here are data from observing random samples of female Hispanic drivers in these two cities. (a) Verify that the 95% CI for the difference in the proportions of female Hispanic drivers in the two cities who wear seat belts pNY −pBT is (0.149,0.353). Show your computation. (b) Determine if the following statements are true or false, and explain your reasoning if you identify the statement as false. i. There was strong evidence that pNY > pBT. ii. 95% of random samples of 220 female Hispanic drivers in New York City and 117 female Hispanic drivers in Boston will yield differences in sample proportions between 14.9% and 35.3%. iii. A 90% confidence interval for pNY −pBT would be wider. iv. A 95% confidence interval for pBT −pNY is (−0.353,−0.149).

College Algebra (MindTap Course List)
12th Edition
ISBN:9781305652231
Author:R. David Gustafson, Jeff Hughes
Publisher:R. David Gustafson, Jeff Hughes
Chapter8: Sequences, Series, And Probability
Section8.3: Arithmetic Sequences And Series
Problem 24E: Find the required means. Insert five arithmetic means between 5and15.

Related questions
Question
The proportion of drivers who use seat belts depends on things like age (young people are more likely to go unbelted) and gender (women are more likely to use belts). It also depends on local law. In New York City, police can stop a driver who is not belted. In Boston at the time of the study, police could cite a driver for not wearing a seat belt only if the driver had been stopped for some other violation. Here are data from observing random samples of female Hispanic drivers in these two cities.
(a) Verify that the 95% CI for the difference in the proportions of female Hispanic drivers in the two cities who wear seat belts pNY −pBT is (0.149,0.353). Show your computation.
(b) Determine if the following statements are true or false, and explain your reasoning if you identify the statement as false.
(b) Determine if the following statements are true or false, and explain your reasoning if you identify the statement as false.
i. There was strong evidence that pNY > pBT.
ii. 95% of random samples of 220 female Hispanic drivers in New York City and 117 female Hispanic drivers in Boston will yield differences in sample proportions between 14.9% and 35.3%.
iii. A 90% confidence interval for pNY −pBT would be wider.
iv. A 95% confidence interval for pBT −pNY is (−0.353,−0.149).
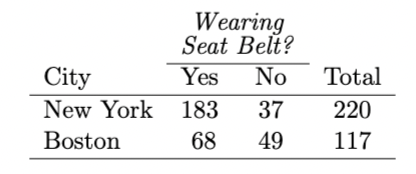
Transcribed Image Text:Wearing
Seat Belt?
Yes
City
New York 183
No
Total
37
220
Boston
68
49
117
Expert Solution
This question has been solved!
Explore an expertly crafted, step-by-step solution for a thorough understanding of key concepts.

This is a popular solution!

Trending now
This is a popular solution!

Step by step
Solved in 3 steps with 1 images

Recommended textbooks for you
College Algebra (MindTap Course List)
Algebra
ISBN:
9781305652231
Author:
R. David Gustafson, Jeff Hughes
Publisher:
Cengage Learning


College Algebra (MindTap Course List)
Algebra
ISBN:
9781305652231
Author:
R. David Gustafson, Jeff Hughes
Publisher:
Cengage Learning