(6+6+6+6+6+6 points) The graph below displays the short-run average variable cost (AVC), the short-run average total cost (ATC), and the marginal cost (MC) curves of a company Y which produces a homogenous product in a perfectly competitive industry. The vertical axis shows cost while horizontal axis shows the level of output. Suppose that the equilibrium price is equal to $30. MC $40 ATC $38 $30 AVC $20 $15 35 40 Output i. Using the graph above, find the profit-maximizing output of Y in the short-run and marginal revenue at this output. ii. Using the graph above, find the total fixed cost of Y. What is the average fixed cost when Y produces 40 units of output? Cost
(6+6+6+6+6+6 points) The graph below displays the short-run average variable cost (AVC), the short-run average total cost (ATC), and the marginal cost (MC) curves of a company Y which produces a homogenous product in a perfectly competitive industry. The vertical axis shows cost while horizontal axis shows the level of output. Suppose that the equilibrium price is equal to $30. MC $40 ATC $38 $30 AVC $20 $15 35 40 Output i. Using the graph above, find the profit-maximizing output of Y in the short-run and marginal revenue at this output. ii. Using the graph above, find the total fixed cost of Y. What is the average fixed cost when Y produces 40 units of output? Cost

Chapter14: Transaction Costs, Asymmetric Information, And Behavioral Economics
Section: Chapter Questions
Problem 1.2P

Related questions
Question
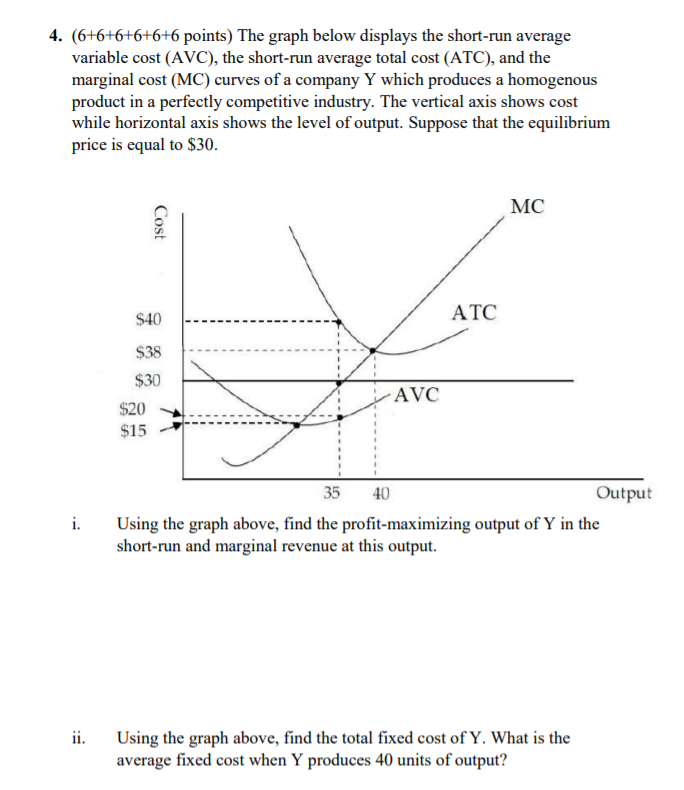
Transcribed Image Text:4. (6+6+6+6+6+6 points) The graph below displays the short-run average
variable cost (AVC), the short-run average total cost (ATC), and the
marginal cost (MC) curves of a company Y which produces a homogenous
product in a perfectly competitive industry. The vertical axis shows cost
while horizontal axis shows the level of output. Suppose that the equilibrium
price is equal to $30.
MC
ATC
$40
$38
$30
AVC
$20
$15
35
40
Output
i.
Using the graph above, find the profit-maximizing output of Y in the
short-run and marginal revenue at this output.
ii.
Using the graph above, find the total fixed cost of Y. What is the
average fixed cost when Y produces 40 units of output?
Cost
Expert Solution
This question has been solved!
Explore an expertly crafted, step-by-step solution for a thorough understanding of key concepts.

Step by step
Solved in 3 steps

Knowledge Booster


Learn more about
Need a deep-dive on the concept behind this application? Look no further. Learn more about this topic, economics and related others by exploring similar questions and additional content below.Recommended textbooks for you

Principles of Economics 2e
Economics
ISBN:
9781947172364
Author:
Steven A. Greenlaw; David Shapiro
Publisher:
OpenStax
Principles of Economics 2e
Economics
ISBN:
9781947172364
Author:
Steven A. Greenlaw; David Shapiro
Publisher:
OpenStax