68% of students at a university live on campus. A random sample found that 30 of 45 male students and 43 of 60 of female students live on campus. At the 0.05 level of significance, is there sufficient evidence to support the claim that a difference exists between the proportions of male and female students who live on campus? A) No, because the test value -0.28 is inside the noncritical region -1.96
68% of students at a university live on campus. A random sample found that 30 of 45 male students and 43 of 60 of female students live on campus. At the 0.05 level of significance, is there sufficient evidence to support the claim that a difference exists between the proportions of male and female students who live on campus? A) No, because the test value -0.28 is inside the noncritical region -1.96

MATLAB: An Introduction with Applications
6th Edition
ISBN:9781119256830
Author:Amos Gilat
Publisher:Amos Gilat
Chapter1: Starting With Matlab
Section: Chapter Questions
Problem 1P

Related questions
Topic Video
Question
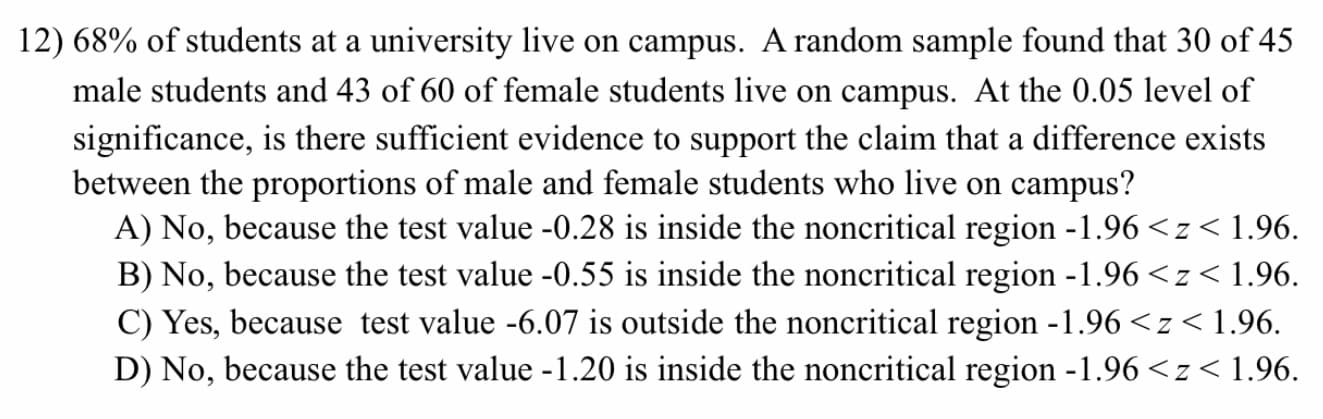
Transcribed Image Text:68% of students at a university live on campus. A random sample found that 30 of 45
male students and 43 of 60 of female students live on campus. At the 0.05 level of
significance, is there sufficient evidence to support the claim that a difference exists
between the proportions of male and female students who live on campus?
A) No, because the test value -0.28 is inside the noncritical region -1.96 <z< 1.96.
B) No, because the test value -0.55 is inside the noncritical region -1.96 <z<1.96.
C) Yes, because test value -6.07 is outside the noncritical region -1.96 <z< 1.96.
D) No, because the test value -1.20 is inside the noncritical region -1.96 <z< 1.96.
Expert Solution
This question has been solved!
Explore an expertly crafted, step-by-step solution for a thorough understanding of key concepts.

This is a popular solution!

Trending now
This is a popular solution!

Step by step
Solved in 2 steps with 4 images

Knowledge Booster


Learn more about
Need a deep-dive on the concept behind this application? Look no further. Learn more about this topic, statistics and related others by exploring similar questions and additional content below.Recommended textbooks for you
MATLAB: An Introduction with Applications
Statistics
ISBN:
9781119256830
Author:
Amos Gilat
Publisher:
John Wiley & Sons Inc

Probability and Statistics for Engineering and th…
Statistics
ISBN:
9781305251809
Author:
Jay L. Devore
Publisher:
Cengage Learning

Statistics for The Behavioral Sciences (MindTap C…
Statistics
ISBN:
9781305504912
Author:
Frederick J Gravetter, Larry B. Wallnau
Publisher:
Cengage Learning
MATLAB: An Introduction with Applications
Statistics
ISBN:
9781119256830
Author:
Amos Gilat
Publisher:
John Wiley & Sons Inc
Probability and Statistics for Engineering and th…
Statistics
ISBN:
9781305251809
Author:
Jay L. Devore
Publisher:
Cengage Learning
Statistics for The Behavioral Sciences (MindTap C…
Statistics
ISBN:
9781305504912
Author:
Frederick J Gravetter, Larry B. Wallnau
Publisher:
Cengage Learning

Elementary Statistics: Picturing the World (7th E…
Statistics
ISBN:
9780134683416
Author:
Ron Larson, Betsy Farber
Publisher:
PEARSON

The Basic Practice of Statistics
Statistics
ISBN:
9781319042578
Author:
David S. Moore, William I. Notz, Michael A. Fligner
Publisher:
W. H. Freeman

Introduction to the Practice of Statistics
Statistics
ISBN:
9781319013387
Author:
David S. Moore, George P. McCabe, Bruce A. Craig
Publisher:
W. H. Freeman