*7. Compute median from the following data: Mid-value Frequency Mid-value Frequency 115 6. 165 60 125 25 175 38 135 48 185 22 145 72 195 3 155 116
*7. Compute median from the following data: Mid-value Frequency Mid-value Frequency 115 6. 165 60 125 25 175 38 135 48 185 22 145 72 195 3 155 116

Holt Mcdougal Larson Pre-algebra: Student Edition 2012
1st Edition
ISBN:9780547587776
Author:HOLT MCDOUGAL
Publisher:HOLT MCDOUGAL
ChapterCSR: Contents Of Student Resources
Section: Chapter Questions
Problem 11.1EP

Related questions
Question
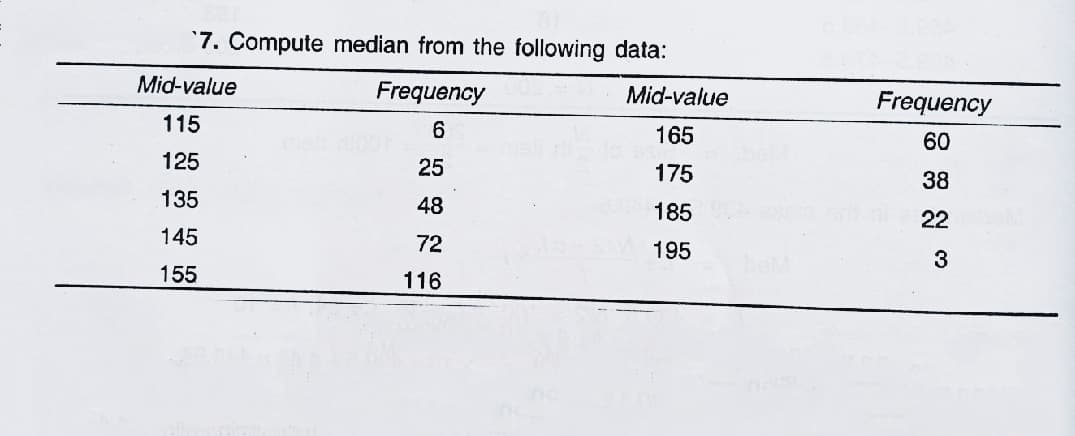
Transcribed Image Text:7. Compute median from the following data:
Mid-value
Frequency
Mid-value
Frequency
115
6.
165
60
125
25
175
38
135
48
185
22
145
72
195
3
155
116
Expert Solution
This question has been solved!
Explore an expertly crafted, step-by-step solution for a thorough understanding of key concepts.

Step by step
Solved in 2 steps with 2 images

Recommended textbooks for you
Holt Mcdougal Larson Pre-algebra: Student Edition…
Algebra
ISBN:
9780547587776
Author:
HOLT MCDOUGAL
Publisher:
HOLT MCDOUGAL
Holt Mcdougal Larson Pre-algebra: Student Edition…
Algebra
ISBN:
9780547587776
Author:
HOLT MCDOUGAL
Publisher:
HOLT MCDOUGAL