7. Consumer surplus for an individual and a market The following graph shows Shen's weekly demand for apple pie, represented by the blue line. Point A represents a point along his weekly demand. The market price of apple pie is $3.00 per slice, as shown by the horizontal black line. PRICE (Dollars per slice) 7.50 6.75 6.00 5.25 Demand 4.50 3.75 3.00 2.25 1.50 0.75 0 Price 2 Shen's Weekly Demand 4 8 8 10 12 QUANTITY (Slices of apple pie) 18 20 From the previous graph, you can tell that Shen is willing to pay 5 per slice, the consumer surplus he gains from the 8th slice of apple pie is 5 ? for his 8th slice of apple pie each week. Since he has to pay only $3.00 Suppose the price of apple pie were to fall to $2.25 per slice. At this lower price, Shen would receive a consumer surplus of $ slice of apple pie he buys. The following graph shows the weekly market demand for apple pie in a small economy. from the 8th Use the purple point (diamond symbol) to shade the area representing consumer surplus when the price (P) of apple ple is $3.00 per slice. Then, use
7. Consumer surplus for an individual and a market The following graph shows Shen's weekly demand for apple pie, represented by the blue line. Point A represents a point along his weekly demand. The market price of apple pie is $3.00 per slice, as shown by the horizontal black line. PRICE (Dollars per slice) 7.50 6.75 6.00 5.25 Demand 4.50 3.75 3.00 2.25 1.50 0.75 0 Price 2 Shen's Weekly Demand 4 8 8 10 12 QUANTITY (Slices of apple pie) 18 20 From the previous graph, you can tell that Shen is willing to pay 5 per slice, the consumer surplus he gains from the 8th slice of apple pie is 5 ? for his 8th slice of apple pie each week. Since he has to pay only $3.00 Suppose the price of apple pie were to fall to $2.25 per slice. At this lower price, Shen would receive a consumer surplus of $ slice of apple pie he buys. The following graph shows the weekly market demand for apple pie in a small economy. from the 8th Use the purple point (diamond symbol) to shade the area representing consumer surplus when the price (P) of apple ple is $3.00 per slice. Then, use

Chapter6: Consumer Choice And Demand
Section: Chapter Questions
Problem 3.7P

Related questions
Question
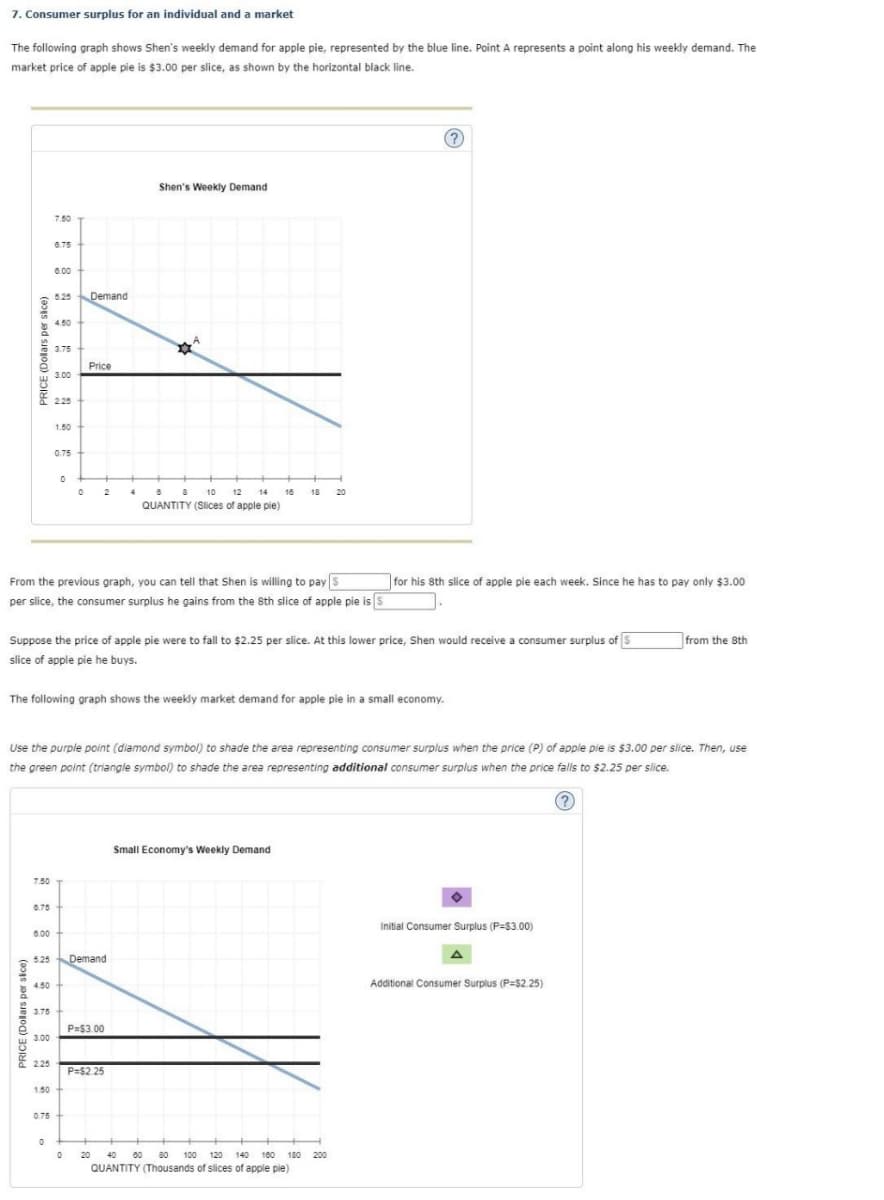
Transcribed Image Text:7. Consumer surplus for an individual and a market
The following graph shows Shen's weekly demand for apple pie, represented by the blue line. Point A represents a point along his weekly demand. The
market price of apple pie is $3.00 per slice, as shown by the horizontal black line.
PRICE (Dollars per slice)
PRICE (Dollars per slice)
7.50
0.75
6.00
4.50
3.75
7.50
3.00
6.75
2.25
6.00
1.50
5.25 Demand
0.75
4.50
0
3.75
3.00
2.25
1.50
0.75
0
From the previous graph, you can tell that Shen is willing to pay S
for his 8th slice of apple pie each week. Since he has to pay only $3.00
per slice, the consumer surplus he gains from the 8th slice of apple pie is S
5.25 Demand
Suppose the price of apple pie were to fall to $2.25 per slice. At this lower price, Shen would receive a consumer surplus of S
slice of apple pie he buys.
The following graph shows the weekly market demand for apple pie in a small economy.
0
Price
Use the purple point (diamond symbol) to shade the area representing consumer surplus when the price (P) of apple pie is $3.00 per slice. Then, use
the green point (triangle symbol) to shade the area representing additional consumer surplus when the price falls to $2.25 per slice.
0
4
Shen's Weekly Demand
P=$3.00
8
10 12 14
QUANTITY (Slices of apple pie)
P=$2.25
20
16
18
20
Small Economy's Weekly Demand
(?)
40 00 80 100 120 140 100 180 200
QUANTITY (Thousands of slices of apple pie)
Initial Consumer Surplus (P-$3.00)
A
from the 8th
Additional Consumer Surplus (P=$2.25)
Expert Solution
This question has been solved!
Explore an expertly crafted, step-by-step solution for a thorough understanding of key concepts.

Step by step
Solved in 5 steps with 4 images

Knowledge Booster


Learn more about
Need a deep-dive on the concept behind this application? Look no further. Learn more about this topic, economics and related others by exploring similar questions and additional content below.Recommended textbooks for you


Essentials of Economics (MindTap Course List)
Economics
ISBN:
9781337091992
Author:
N. Gregory Mankiw
Publisher:
Cengage Learning
Essentials of Economics (MindTap Course List)
Economics
ISBN:
9781337091992
Author:
N. Gregory Mankiw
Publisher:
Cengage Learning


Economics (MindTap Course List)
Economics
ISBN:
9781337617383
Author:
Roger A. Arnold
Publisher:
Cengage Learning
