7. Demand and supply curves for products when there are negative or positive externalities. Quantity (A) Quantity (B) Quantity (C) On this graph above which one indicates the effect after the government subsidizes the producer because there are positive externalities from this product? (A. B. C ). On this graph above which one indicates the effect after the government subsidizes consumers for this product which has a positive externality? CA. B, C ). On this graph above which one indicates the effect after the producer was prevented from causing a negative externality or was forced to pay a tax to cover these costs? (A. B, C).
7. Demand and supply curves for products when there are negative or positive externalities. Quantity (A) Quantity (B) Quantity (C) On this graph above which one indicates the effect after the government subsidizes the producer because there are positive externalities from this product? (A. B. C ). On this graph above which one indicates the effect after the government subsidizes consumers for this product which has a positive externality? CA. B, C ). On this graph above which one indicates the effect after the producer was prevented from causing a negative externality or was forced to pay a tax to cover these costs? (A. B, C).

Chapter17: Externalities And The Environment
Section: Chapter Questions
Problem 2.3P: (Negative Externalities) Suppose you wish to reduce a negative externality by imposing a tax on the...

Related questions
Question
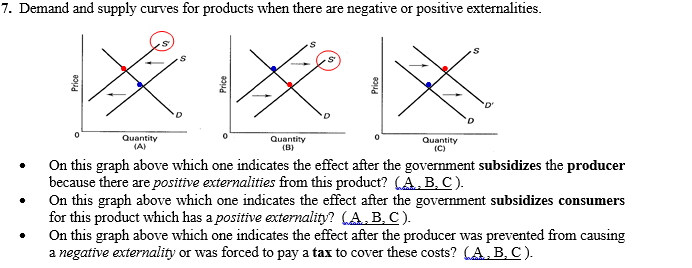
Transcribed Image Text:7. Demand and supply curves for products when there are negative or positive externalities.
Quantity
(A)
Quantity
(B)
Quantity
(C)
On this graph above which one indicates the effect after the government subsidizes the producer
because there are positive externalities from this product? (A. B. C ).
On this graph above which one indicates the effect after the government subsidizes consumers
for this product which has a positive externality? CA. B, C ).
On this graph above which one indicates the effect after the producer was prevented from causing
a negative externality or was forced to pay a tax to cover these costs? (A. B, C).
Expert Solution
This question has been solved!
Explore an expertly crafted, step-by-step solution for a thorough understanding of key concepts.

This is a popular solution!

Trending now
This is a popular solution!

Step by step
Solved in 2 steps

Recommended textbooks for you

Principles of Economics 2e
Economics
ISBN:
9781947172364
Author:
Steven A. Greenlaw; David Shapiro
Publisher:
OpenStax

Essentials of Economics (MindTap Course List)
Economics
ISBN:
9781337091992
Author:
N. Gregory Mankiw
Publisher:
Cengage Learning
Principles of Economics 2e
Economics
ISBN:
9781947172364
Author:
Steven A. Greenlaw; David Shapiro
Publisher:
OpenStax
Essentials of Economics (MindTap Course List)
Economics
ISBN:
9781337091992
Author:
N. Gregory Mankiw
Publisher:
Cengage Learning

Principles of Economics, 7th Edition (MindTap Cou…
Economics
ISBN:
9781285165875
Author:
N. Gregory Mankiw
Publisher:
Cengage Learning

Principles of Economics (MindTap Course List)
Economics
ISBN:
9781305585126
Author:
N. Gregory Mankiw
Publisher:
Cengage Learning

Principles of Microeconomics (MindTap Course List)
Economics
ISBN:
9781305971493
Author:
N. Gregory Mankiw
Publisher:
Cengage Learning