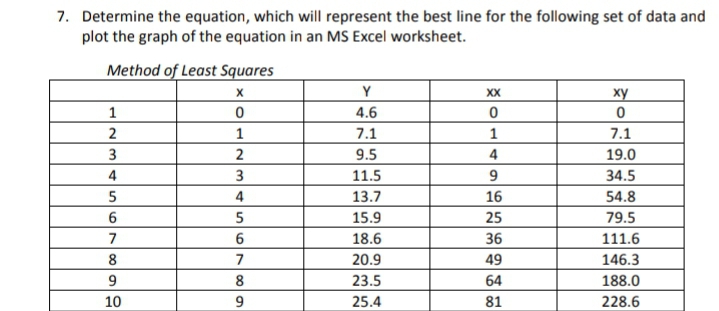
7. Determine the equation, which will represent the best line for the following set of data and plot the graph of the equation in an MS Excel worksheet. Method of Least Squares Y XX ху 1 4.6 2 1 7.1 1 7.1 2 9.5 4 19.0 4 3 11.5 9 34.5 5 4 13.7 16 54.8 6 5 15.9 25 79.5 7 18.6 36 111.6 8 7 20.9 49 146.3 8 23.5 64 188.0 10 25.4 81 228.6


Q: A large airline company called Fusion Fly monitors customer satisfaction by asking customers to rate…
A:
Q: In a sample of 250 students in a university, 50, or 20%, are Math majors. Based on the above…
A: Solution: Given information: n= 250 Sample size of students p^= 0.20 Sample proportion of math…
Q: From the data given below prove that the Fisher's ideal index number satis the time reversal test…
A:
Q: The following confidence interval gives a range of likely values for the average commute distance of…
A: Given that Lower limit (L.L)=7.4 Upper limit ( U.L ) =9.8 Find x¯= ?E= ?
Q: Read the table and answer the question. Favorite Game Soccer Basketball Total Boys 34 106 Girls 28…
A:
Q: Each sweat shop worker at a computer factory can put together 4.9 computers per hour on average with…
A:
Q: chemical manufacturer is concerned about the degree of impurity in the raw material shipments…
A: Given that ; Sample size (n) = 10 S = 2.36 At 95 % confidence interval By using population variance…
Q: A race director for a local 10 kilometer “fun run” is trying to estimate the mean time it will take…
A: Confidence interval approach: If the confidence interval contains the population parameter value,…
Q: Find the following binomial probabilities. Show all your work. Round to 4 decimal places. p= 0.35…
A: Let X be the random variable from binomial distribution with probability (p) = 0.35 and sample size…
Q: The number of shipwrecks in a year along a certain shipping route has a population distribution as…
A: By central limit theorem, The distribution of the sample mean is Normally distributed, if the sample…
Q: Researchers reported a study in which 396 domestic violence defendants were randomly assigned to…
A: The number of people arrested within 12 months in the counselling group is 48 out of 224.
Q: a) The table below shows the probability distribution of the discrete random variable X. 2 4. 6…
A:
Q: Refer to the ANOVA table for this regression. Source d.f. SS MS Regression 3 1,196,410 398,803…
A: According to the given information in this question We need to identify the degree of freedom
Q: An outbreak of the deadly Ebola virus in 2002 and 2003 killed 91 of the 95 gorillas in 7 home ranges…
A: Correlation Correlation is a statistical concept that refers to the level toward which two variables…
Q: The Sweet Encounter is a touring international candy festival. The festival's most popular product…
A: For the given data Population proportion =? Sample proportion =?
Q: When they send out theirfundraising letter, a philanthropic organization typically gets a return…
A: According to central limit theorem, as sample size increases the sampling distribution of the sample…
Q: Conduct a test at the a = 0.05 level of significance by determining (a) the null and alternative…
A:
Q: According to the Center for Disease Control (CDC) during the 2018-2019 season the percent of…
A:
Q: One year Thomas had the lowest ERA (earned-run average, mean number of runs yielded per nine innings…
A:
Q: According to a 2017 report, 37% of adults aged 18 to 29 had student loan debt. Suppose in a random…
A: For the given data Z =?
Q: The table below shows the probability distribution of the discrete random variable a) Find the…
A:
Q: What Excel formula would you use to find the mean monthly rainfall? =(max(D2:D25)-min(D2:D25))/2…
A: to calculate the total rainfall per month for each of the 24 months. The formula for this variable…
Q: The mean finish time for a yearly amateur auto race was 186.84 minutes with a standard deviation of…
A:
Q: What are the approximate numbers of participants needed for each of the following planned studies to…
A: Given Expected mean in all study S pooled Find The approximate number of participants needed
Q: A professor would like to use a 97% confidence interval to estimate the mean amount of time IRSC…
A: Obtain the sample size needed. The sample size needed is obtained below as follows : Use EXCEL…
Q: W STATS: Assign X L calculator - Se X how to find p X VP Value from S University of X Statdisk Onlir…
A: Given that Population mean μ =1.547 Population mean μ is not equal to 1.547
Q: rrives on time 82 percent of the time. Suppose 175 flights are randomly selected. Use the normal…
A:
Q: (b) What would the sampling distribution of the sample mean for a random sample of size n=9 years…
A:
Q: In the construction of a cost of living index the weights assigned to the different items were as…
A:
Q: Suppose that an allergist wishes to test the hypothesis that at least 30% of the public is allergic…
A: Given that Suppose that an allergist wishes to test the hypothesis that at least 30% of the public…
Q: For the following graph, if we add the seventh class, what it would be and what is its midpoint? 8.…
A:
Q: Suppose D is a binary random variable with P(D = 0) = P(D= 1) = . C ioned on D, a continuous random…
A: 3. From the given information, fx|Dx|d=0=1, 0<x<1fx|Dx|d=1=2*12=1, 0<x<1 And…
Q: Consider the following dataset, which contains two variables. Age Education 24 11 25 14 22 16 38 14…
A: We have given that the dataset, which contains two variables Age and Education.
Q: The amount of syrup that people put on their pancakes is normally distributed with mean 59 mL and…
A: As per bartleby guideline expert have to answer first three subparts only dear student please upload…
Q: In a multiple regression equation, what does beta indicate?
A: In multiple regression equation there are two or more predictor variables and one response variable.
Q: college would like to estimate the proportion of its students that work full-time while going to…
A: Given that n=389 , X=42
Q: Suppose that 70% of a town’s population have brown eyes, 40% have black hair, and 30% have both…
A: We have given that population have brown eyes = 70% =0.70 population have black hair = 40% = 0.40…
Q: The table below shows the average score of the150 students sampled from the Technical School of…
A:
Q: Twenty children with autism participated in a study of the effectiveness of augmentative…
A: Given that Statement : Researchers hypothesized that the children would show a higher number of…
Q: From the data given below show that the simple aggregative method satisfies he time reversal test…
A:
Q: amine uie accompanying sampie data for the variables y agn d belUW 3 5. 3 4 4. A. ihere appears to…
A:
Q: A highly selective boarding school will only admit students who place at least 2 standard deviations…
A:
Q: People with O-negative blood are called "universal donors" because O- negative blood can be given to…
A: From the given information, the probability of people having type O-negative blood is p=0.06.
Q: Ep1(90 + 1) (iii) Epo(9o + 91) Χ 100 Ep1 V9091 (iv) Epo vg091 Χ 100
A:
Q: Compute and report the 95% prediction interval for annual profit for a new restaurant in Kamloops…
A:
Q: Suppose the lengths of the pregnancies of a certain animal are approximately normally distributed…
A:
Q: A study is developed to examine the effects of vitamin and milk supplements on infant weight gain.…
A: Solution: Given information: k= 4 groups n=20 total observations
Q: An investment website can tell what devices are used to access their site. The site managers wonder…
A: It is given that n=420 and p=0.40.
Q: Q3. Consider the following table as an example of a possible data set of the people in Bangladesh.…
A:
Q: The life insurance policies of an insurance company are classified by: • Age of the insured 1. Under…
A: Classification : A type is a grouping based on shared qualities; a class, whereas classification is…

Step by step
Solved in 3 steps with 3 images

- Suppose 5 out of 25 data points in a weighted least-squares problem have a y-measurement that is less reliable than the others, and they are to be weighted half as much as the other 20 points. One method is to weight the 20 points by a factor of 1 and the other 5 by a factor of 1/2. A second method is to weight the 20 points by a factor of 2 and the other 5 by a factor of 1. Do the two methods produce different results? Explain.The regional transit authority for a major metropolitan area wants to determine whetherthere is any relationship between the age of a bus and the annual maintenance cost. Asample of 10 buses resulted in the following data. Age of Bus (year) Maintenance Cost ($) 1 350 2 370 2 480 2 520 2 590 3 550 4 750 4 800 5 790 5 950 a. Develop the least squares estimated regression equation.b. Test to see whether the two variables are significantly related with α = .5.c. Did the least squares line provide a good fit to the observed data? Explain.d. Develop a 95% prediction interval for the maintenance cost for a specific bus thatis 4 years old.Select the equation of the least squares line for the data: (51.00, 1.0), (48.75, 2.5), (52.50, .5), (46.50, 5.0), (45.00, 4.5), (41.25, 6.5), (43.50, 5.0). a) ŷ = -28.956 − 0.54067x b) ŷ = 28.956 − 0.59474x c) ŷ = 0.54067x − 28.956 d) ŷ = 31.852 − 0.59474x e) ŷ = 28.956 − 0.54067x f) None of the above
- The following table shows the percent of water and the number of calories in various canned soups to which 100 g of water are added. (show all the necessary solution) Percent Water in Soups % Water Calories 83.3 28 92.3 26 91.9 39 89.4 57 89.5 57 90.5 36 91.9 32 91.7 32 a. Find the equation of the least squares line for the data. b. Use the equation in part a to find the expected number of calories in a soup that is 87% water. c. Determine the correlation coefficient of the data.Determine the best (according to sum-of-squares-measure) curve y = Aebx, through the dataabove.Transformed equationln(y) = ln(A) + bxorY = a + bx.A pediatrician wants to determine the relationship that exists between achild’s height, x, and head circumference, y. She randomly selects 11 children from her practice, measures their heights and head circumferences, and conducts the least-squares regression analysis with the simple linear model using StatCrunch. The output is given below: (a) Write down the equation of the least-squares regression line treating height as the explanatory variable and head circumference as the response variable. (b) Interpret the slope and y-intercept, if appropriate. (c) Use the regression equation to predict the head circumference of a child who is 25 inches tall. Assume that the regression model is applicable.(d) It is observed that one child who is 25 inches tall has a head circumference of 17.5 inches. Is the observed value above or below average among all children with heights of 25 inches?
- What is the least-squares line approximation to a set of datapoints? How is the line determined?Suppose a doctor measures the height, x, and head circumference, y, of 8 children and obtains the data below. Thecorrelation coefficient is 0.944 and the least squares regression line is y = 0.199x + 11.982. Complete parts (a) and (b)below.Height, x27.5 25.5 26.25 25.25 27.5 26.25 26 27.25 27.25 27 27.25 ФHead Circumference, # 17.5 17.0 17.2 17.0 17.5 17.3 17.2 17.4 17.3 17.3 17.4(a) Compute the coefficient of determination, R?R?.% (Round to one decimal place as needed.)(b) Interpret the coefficient of determination and comment on the adequacy of the linear model.Approximately % of the variation inis explained by the least-squares regression model.According to the residual plot, the linear model appears to be (Round to one decimal place as needed.)After deciding on the appropriateness of a linear model relating coffee sales and maximum temperature, the managers calculate the equation of the least-squares regression line to be =y−2553.5211.33x . This is the line shown in the scatter plot above.Based on the sample data and the regression line, complete the following. (a)For these data, temperature values that are less than the mean of the temperature values tend to be paired with coffee sales values that are ▼(Choose one) the mean of the coffee sales values. (b)According to the regression equation, for an increase of one degree in temperature, there is a corresponding ▼(Choose one) of 11.33 dollars in coffee sales. (c)What was the observed coffee sales value (in dollars) when the temperature was 39.6 degrees Fahrenheit? (d)From the regression equation, what is the predicted coffee sales value (in dollars) when the temperature is 39.6 degrees Fahrenheit? (Round your answer to at least…
- The following data is about the number of turns required to break a certain type of forged alloy bar, as well as the percentages of two alloying elements present in the metal. A) Fit a least squares regression plane and use its equation to estimate the number of turns required to break one of the bars, when x1 = 2.5 and x2 = 12 In the tabley = number of turnsx1 =% of element Ax2 =% of element B1) -Describe the association between College Tuition and Median Student Loan Debt for Graduates based on the scatter plot.-Identify and interpret the y-intercept and slope of your least squares regression line -Identify and interpret your coefficient of determination1. Prior to being hired, the ve salespersons for a computer store were given a standard sales aptitude test. For each individual, the score achieved on the aptitude test and the number of computer systems sold during the first 3 months of their employment are shown in the attached image. (a) Determine the least-squares regression line and interpret its slope. (b) Estimate, for a new employee who scores 60 on the sales aptitude test, the number of units the new employee will sell in her first 3 months with the company. (c) Find the standard error of estimate. (d) Find the r-square of the model.
