A study is developed to examine the effects of vitamin and milk supplements on infant weight gain. Four diet plans are considered: Diet A involves a regular diet plus the vitamin supplement, Diet B involves a regular diet plus the special milk formula, Diet C is our control diet (ie. no restrictions or special considerations, and Diet D involves a regular diet plus the vitamin and the special milk formula. Twenty infants are selected for the investigation and each is randomized to one of the four competing diet programs. The descriptive statistics for the 4 groups are shown below:
A study is developed to examine the effects of vitamin and milk supplements on infant weight gain. Four diet plans are considered: Diet A involves a regular diet plus the vitamin supplement, Diet B involves a regular diet plus the special milk formula, Diet C is our control diet (ie. no restrictions or special considerations, and Diet D involves a regular diet plus the vitamin and the special milk formula. Twenty infants are selected for the investigation and each is randomized to one of the four competing diet programs. The descriptive statistics for the 4 groups are shown below:

MATLAB: An Introduction with Applications
6th Edition
ISBN:9781119256830
Author:Amos Gilat
Publisher:Amos Gilat
Chapter1: Starting With Matlab
Section: Chapter Questions
Problem 1P

Related questions
Question
100%
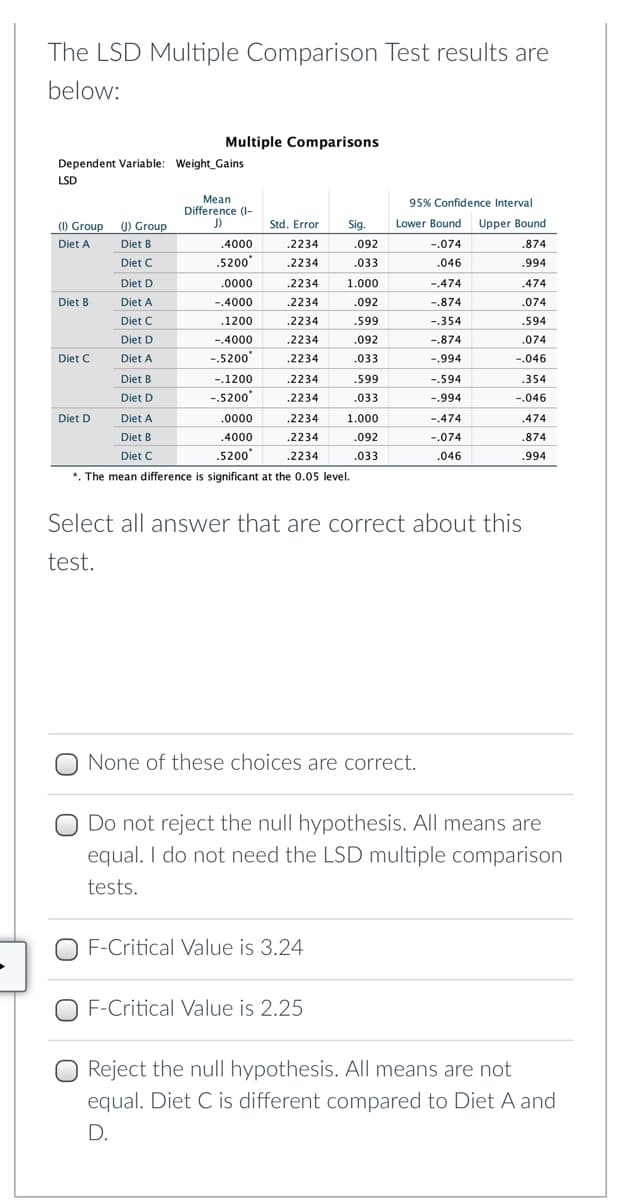
Transcribed Image Text:The LSD Multiple Comparison Test results are
below:
Multiple Comparisons
Dependent Variable: Weight_Gains
LSD
Mean
Difference (I-
J)
95% Confidence Interval
(1) Group 0) Group
Std. Error
Sig.
Lower Bound Upper Bound
Diet A
Diet B
.4000
.2234
.092
-.074
.874
Diet C
.5200
.2234
.033
.046
.994
Diet D
.0000
.2234
1.000
-.474
.474
Diet B
Diet A
-.4000
.2234
.092
-.874
.074
Diet C
.1200
.2234
.599
-.354
.594
Diet D
-.4000
.2234
.092
-.874
.074
Diet C
Diet A
-.5200
.2234
.033
-.994
-.046
Diet B
-.1200
.2234
.599
-.594
.354
Diet D
-.5200
.2234
.033
-.994
-.046
Diet D
Diet A
.0000
.2234
1.000
-.474
.474
Diet B
.4000
.2234
.092
-.074
.874
Diet C
.5200
.2234
.033
.046
.994
*. The mean difference is significant at the 0.05 level.
Select all answer that are correct about this
test.
None of these choices are correct.
O Do not reject the null hypothesis. All means are
equal. I do not need the LSD multiple comparison
tests.
F-Critical Value is 3.24
O F-Critical Value is 2.25
O Reject the null hypothesis. All means are not
equal. Diet C is different compared to Diet A and
D.
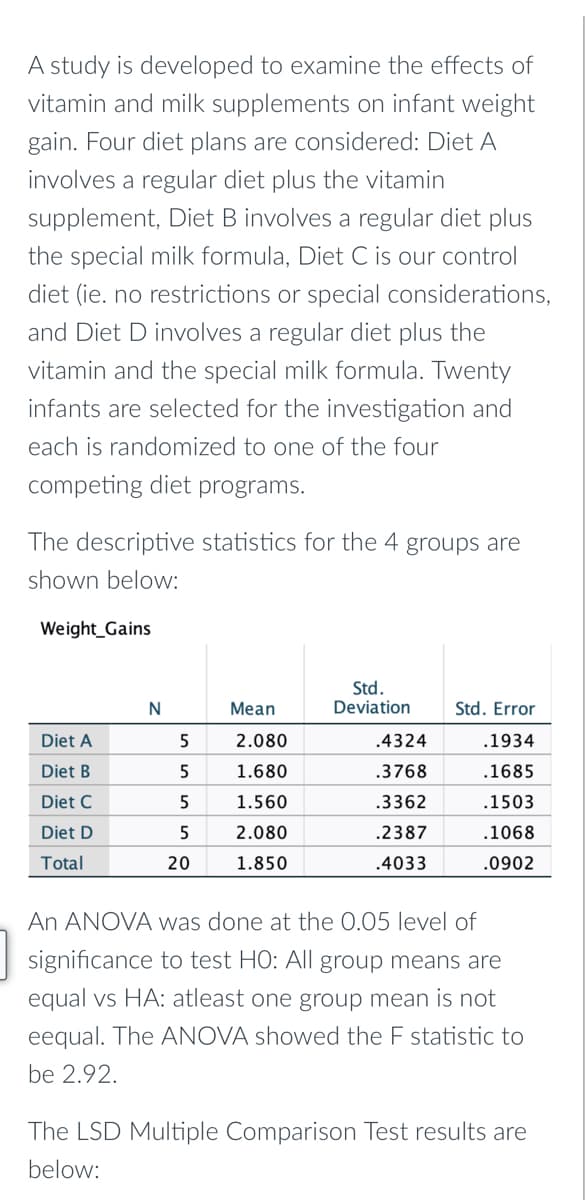
Transcribed Image Text:A study is developed to examine the effects of
vitamin and milk supplements on infant weight
gain. Four diet plans are considered: Diet A
involves a regular diet plus the vitamin
supplement, Diet B involves a regular diet plus
the special milk formula, Diet C is our control
diet (ie. no restrictions or special considerations,
and Diet D involves a regular diet plus the
vitamin and the special milk formula. Twenty
infants are selected for the investigation and
each is randomized to one of the four
competing diet programs.
The descriptive statistics for the 4 groups are
shown below:
Weight_Gains
Std.
Deviation
N
Mean
Std. Error
Diet A
2.080
.4324
.1934
Diet B
1.680
.3768
.1685
Diet C
1.560
.3362
.1503
Diet D
5
2.080
.2387
.1068
Total
20
1.850
.4033
.0902
An ANOVA was done at the 0.05 level of
significance to test HO: All group means are
equal vs HA: atleast one group mean is not
eequal. The ANOVA showed the F statistic to
be 2.92.
The LSD Multiple Comparison Test results are
below:
Expert Solution
This question has been solved!
Explore an expertly crafted, step-by-step solution for a thorough understanding of key concepts.

This is a popular solution!

Trending now
This is a popular solution!

Step by step
Solved in 2 steps

Recommended textbooks for you
MATLAB: An Introduction with Applications
Statistics
ISBN:
9781119256830
Author:
Amos Gilat
Publisher:
John Wiley & Sons Inc

Probability and Statistics for Engineering and th…
Statistics
ISBN:
9781305251809
Author:
Jay L. Devore
Publisher:
Cengage Learning

Statistics for The Behavioral Sciences (MindTap C…
Statistics
ISBN:
9781305504912
Author:
Frederick J Gravetter, Larry B. Wallnau
Publisher:
Cengage Learning
MATLAB: An Introduction with Applications
Statistics
ISBN:
9781119256830
Author:
Amos Gilat
Publisher:
John Wiley & Sons Inc
Probability and Statistics for Engineering and th…
Statistics
ISBN:
9781305251809
Author:
Jay L. Devore
Publisher:
Cengage Learning
Statistics for The Behavioral Sciences (MindTap C…
Statistics
ISBN:
9781305504912
Author:
Frederick J Gravetter, Larry B. Wallnau
Publisher:
Cengage Learning

Elementary Statistics: Picturing the World (7th E…
Statistics
ISBN:
9780134683416
Author:
Ron Larson, Betsy Farber
Publisher:
PEARSON

The Basic Practice of Statistics
Statistics
ISBN:
9781319042578
Author:
David S. Moore, William I. Notz, Michael A. Fligner
Publisher:
W. H. Freeman

Introduction to the Practice of Statistics
Statistics
ISBN:
9781319013387
Author:
David S. Moore, George P. McCabe, Bruce A. Craig
Publisher:
W. H. Freeman