7. Enumerate the different sampling techniques and classify then as probability or non- probability sampling.
7. Enumerate the different sampling techniques and classify then as probability or non- probability sampling.

Glencoe Algebra 1, Student Edition, 9780079039897, 0079039898, 2018
18th Edition
ISBN:9780079039897
Author:Carter
Publisher:Carter
Chapter10: Statistics
Section10.4: Distributions Of Data
Problem 19PFA

Related questions
Question
Answer number 7 and 8 pls. I don't want to waste my money here.
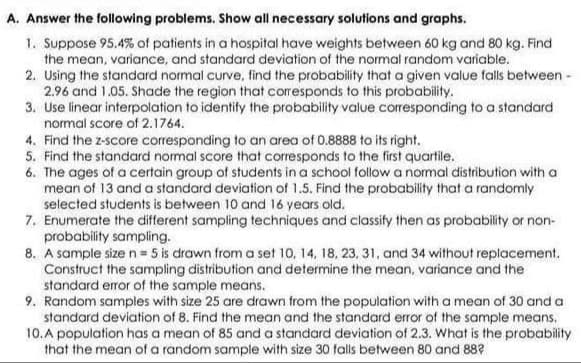
Transcribed Image Text:A. Answer the following problems. Show all necessary solutions and graphs.
1. Suppose 95.4% of patients in a hospital have weights between 60 kg and 80 kg. Find
the mean, variance, and standard deviation of the normal random variable.
2. Using the standard normal curve, find the probability that a given value falls between -
2.96 and 1.05. Shade the region that corresponds to this probability.
3. Use linear interpolation to identify the probability value corresponding to a standard
normal score of 2.1764.
4. Find the z-score corresponding to an area of 0.8888 to its right.
5. Find the standard normal score that corresponds to the first quartile.
6. The ages of a certain group of students in a school follow a normal distribution with a
mean of 13 and a standard deviation of 1.5. Find the probability that a randomly
selected students is between 10 and 16 years old.
7. Enumerate the different sampling techniques and classify then as probatbility or non-
probability sampling.
8. A sample size n 5 is drawn from a set 10, 14, 18, 23, 31, and 34 without replacement.
Construct the sampling distribution and determine the mean, variance and the
standard error of the sample means.
9. Random samples with size 25 are drawn from the population with a mean of 30 and a
standard deviation of 8. Find the mean and the standard error of the sample means.
10.A population has a mean of 85 and a standard deviation of 2.3. What is the probability
that the mean of a random sample with size 30 falls between 80 and 88?
Expert Solution
This question has been solved!
Explore an expertly crafted, step-by-step solution for a thorough understanding of key concepts.

Step by step
Solved in 3 steps

Recommended textbooks for you
Glencoe Algebra 1, Student Edition, 9780079039897…
Algebra
ISBN:
9780079039897
Author:
Carter
Publisher:
McGraw Hill
Glencoe Algebra 1, Student Edition, 9780079039897…
Algebra
ISBN:
9780079039897
Author:
Carter
Publisher:
McGraw Hill