Suppose you estimate the following regression function where Y, X1, and X2 are continuous variables measured in integers: Yhat=0.5+0 25 X1-0.01"X2-0.43'XE3 Suppose that X2=X1X1 The standard error of beta0hat is 0.10. The standard error of betathat is 0.05 The standard error of beta2hat is 0.005. The standard error of beta3hat is 0.05. What is the marginal effect of X1 when it increases from 3 to 4? Round to two decimal places
Suppose you estimate the following regression function where Y, X1, and X2 are continuous variables measured in integers: Yhat=0.5+0 25 X1-0.01"X2-0.43'XE3 Suppose that X2=X1X1 The standard error of beta0hat is 0.10. The standard error of betathat is 0.05 The standard error of beta2hat is 0.005. The standard error of beta3hat is 0.05. What is the marginal effect of X1 when it increases from 3 to 4? Round to two decimal places

College Algebra
7th Edition
ISBN:9781305115545
Author:James Stewart, Lothar Redlin, Saleem Watson
Publisher:James Stewart, Lothar Redlin, Saleem Watson
Chapter1: Equations And Graphs
Section: Chapter Questions
Problem 10T: Olympic Pole Vault The graph in Figure 7 indicates that in recent years the winning Olympic men’s...

Related questions
Question
That is whatever is given. i attached a photo below. But for those who dont see it the regression
Yhat=0.5+0.25*X1-0.01*X2-0.43*X3
Suppose that X2=X1*X1
the standard error of beta0hat = 0.10
the standard error of beta1hat is 0.05
the standard error of beta2hat is 0.005
the stabdard error of beat3hat is 0.05
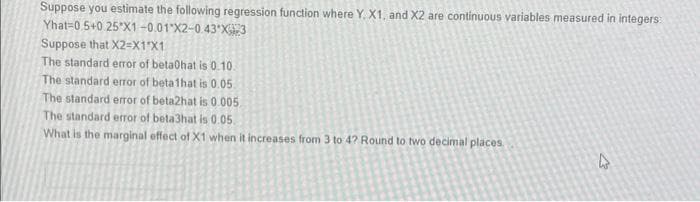
Transcribed Image Text:Suppose you estimate the following regression function where Y, X1, and X2 are continuous variables measured in integers:
Yhat=0 5+0 25°X1-0.01"X2-0.43°X3
Suppose that X2=X1X1
The standard error of beta0hat is 0.10.
The standard error of betathat is 0.05
The standard error of beta2hat is 0.005
The standard error of beta3hat is 0.05.
What is the marginal effect of X1 when it increases from 3 to 4? Round to two decimal places
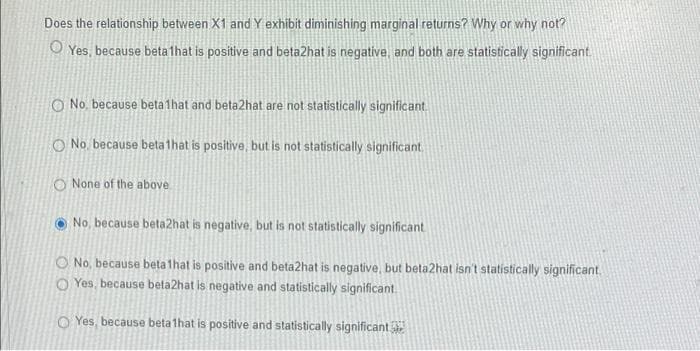
Transcribed Image Text:Does the relationship between X1 and Y exhibit diminishing marginal returns? Why or why not?
O Yes, because beta1hat is positive and beta2hat is negative, and both are statistically significant.
O No, because beta1hat and beta2hat are not statistically significant.
O No, because betathat is positive, but is not statistically significant
O None of the above
O No, because beta2hat is negative, but is not statistically significant
O No, because beta 1hat is positive and beta2hat is negative, but beta2hat isn't statistically significant.
O Yes, because beta2hat is negative and statistically significant.
O Yes, because beta that is positive and statistically significant
Expert Solution
This question has been solved!
Explore an expertly crafted, step-by-step solution for a thorough understanding of key concepts.

This is a popular solution!

Trending now
This is a popular solution!

Step by step
Solved in 2 steps with 1 images

Recommended textbooks for you
College Algebra
Algebra
ISBN:
9781305115545
Author:
James Stewart, Lothar Redlin, Saleem Watson
Publisher:
Cengage Learning
College Algebra
Algebra
ISBN:
9781305115545
Author:
James Stewart, Lothar Redlin, Saleem Watson
Publisher:
Cengage Learning