7. From the following two cases find out whether the data are consistent or not: (A) = 100, (B) = 150, (AB) = 60, N = 500 100, (B) = 150, (AB) = 140, N = 500 )谁 Case I %3D %3D Case II (A) = %3D %3D
7. From the following two cases find out whether the data are consistent or not: (A) = 100, (B) = 150, (AB) = 60, N = 500 100, (B) = 150, (AB) = 140, N = 500 )谁 Case I %3D %3D Case II (A) = %3D %3D

Linear Algebra: A Modern Introduction
4th Edition
ISBN:9781285463247
Author:David Poole
Publisher:David Poole
Chapter4: Eigenvalues And Eigenvectors
Section4.6: Applications And The Perron-frobenius Theorem
Problem 25EQ

Related questions
Question
Solve this
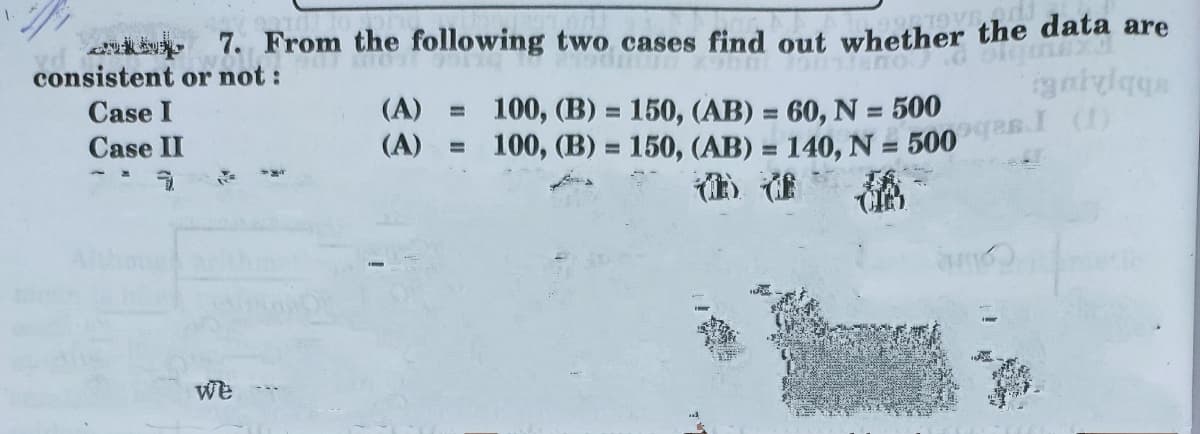
Transcribed Image Text:(A) = 100, (B) = 150, (AB) = 140, N = 500gas.I (1)
a 7. From the following two cases find out whether the data are
consistent or not :
Case I
(A) =
100, (B) = 150, (AB) = 60, N = 500
%3D
Case II
)谁
We
Expert Solution
This question has been solved!
Explore an expertly crafted, step-by-step solution for a thorough understanding of key concepts.

Step by step
Solved in 2 steps with 2 images

Recommended textbooks for you
Linear Algebra: A Modern Introduction
Algebra
ISBN:
9781285463247
Author:
David Poole
Publisher:
Cengage Learning

Glencoe Algebra 1, Student Edition, 9780079039897…
Algebra
ISBN:
9780079039897
Author:
Carter
Publisher:
McGraw Hill

Trigonometry (MindTap Course List)
Trigonometry
ISBN:
9781337278461
Author:
Ron Larson
Publisher:
Cengage Learning
Linear Algebra: A Modern Introduction
Algebra
ISBN:
9781285463247
Author:
David Poole
Publisher:
Cengage Learning
Glencoe Algebra 1, Student Edition, 9780079039897…
Algebra
ISBN:
9780079039897
Author:
Carter
Publisher:
McGraw Hill
Trigonometry (MindTap Course List)
Trigonometry
ISBN:
9781337278461
Author:
Ron Larson
Publisher:
Cengage Learning

College Algebra
Algebra
ISBN:
9781305115545
Author:
James Stewart, Lothar Redlin, Saleem Watson
Publisher:
Cengage Learning