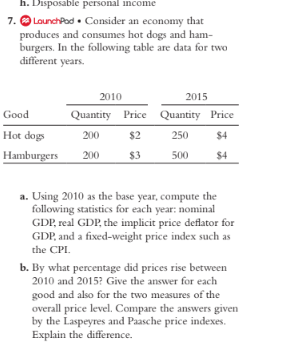
7. O LounchPod Consider an economy that produces and consumes hot dogs and ham- burgers. In the following table are data for two different years. 2010 2015 Good Quantity Price Quantity Price Hot dogs 200 $2 250 $4 Нamburgers 200 $3 500 $4 a. Using 2010 as the base year, compute the following statistics for each year: nominal GDP, real GDP, the implicit price deflator for GDP, and a fixed-weight price index such as the CPI. b. By what percentage did prices rise between 2010 and 2015? Give the answer for each good and also for the two measures of the overall price level. Compare the answers given by the Laspeyres and Paasche price indexes. Explain the difference.
7. O LounchPod Consider an economy that produces and consumes hot dogs and ham- burgers. In the following table are data for two different years. 2010 2015 Good Quantity Price Quantity Price Hot dogs 200 $2 250 $4 Нamburgers 200 $3 500 $4 a. Using 2010 as the base year, compute the following statistics for each year: nominal GDP, real GDP, the implicit price deflator for GDP, and a fixed-weight price index such as the CPI. b. By what percentage did prices rise between 2010 and 2015? Give the answer for each good and also for the two measures of the overall price level. Compare the answers given by the Laspeyres and Paasche price indexes. Explain the difference.

Brief Principles of Macroeconomics (MindTap Course List)
8th Edition
ISBN:9781337091985
Author:N. Gregory Mankiw
Publisher:N. Gregory Mankiw
Chapter5: Measuring A Nation's Income
Section: Chapter Questions
Problem 5PA

Related questions
Question
Please answer both (a) and (b)
Transcribed Image Text:h. Disposable personal income
7. O LounchPod • Consider an economy that
produces and consumes hot dogs and ham-
burgers. In the following table are data for two
different years.
2010
2015
Good
Quantity Price
Quantity Price
Hot dogs
200
$2
250
$4
Hamburgers
200
$3
500
$4
a. Using 2010 as the base year, compute the
following statistics for each year: nominal
GDP, real GDP, the implicit price deflator for
GDP, and a fixed-weight price index such as
the CPI.
b. By what percentage did prices rise between
2010 and 2015? Give the answer for each
good and also for the two measures of the
overall price level. Compare the answers given
by the Laspeyres and Paasche price indexes.
Explain the difference.
Expert Solution
This question has been solved!
Explore an expertly crafted, step-by-step solution for a thorough understanding of key concepts.

This is a popular solution!

Trending now
This is a popular solution!

Step by step
Solved in 3 steps

Knowledge Booster


Learn more about
Need a deep-dive on the concept behind this application? Look no further. Learn more about this topic, economics and related others by exploring similar questions and additional content below.Recommended textbooks for you
Brief Principles of Macroeconomics (MindTap Cours…
Economics
ISBN:
9781337091985
Author:
N. Gregory Mankiw
Publisher:
Cengage Learning

Essentials of Economics (MindTap Course List)
Economics
ISBN:
9781337091992
Author:
N. Gregory Mankiw
Publisher:
Cengage Learning

Exploring Economics
Economics
ISBN:
9781544336329
Author:
Robert L. Sexton
Publisher:
SAGE Publications, Inc
Brief Principles of Macroeconomics (MindTap Cours…
Economics
ISBN:
9781337091985
Author:
N. Gregory Mankiw
Publisher:
Cengage Learning
Essentials of Economics (MindTap Course List)
Economics
ISBN:
9781337091992
Author:
N. Gregory Mankiw
Publisher:
Cengage Learning
Exploring Economics
Economics
ISBN:
9781544336329
Author:
Robert L. Sexton
Publisher:
SAGE Publications, Inc


Principles of Economics 2e
Economics
ISBN:
9781947172364
Author:
Steven A. Greenlaw; David Shapiro
Publisher:
OpenStax
