7. Suppose we want to test, at the 5% level of significance, whether there is a linear relationship between æ and y. That is, we want to test the null hypothesis Ho : B1 = 0 against the alternative hypothesis Ha : B1 7 0. What is the distribution of the test statistic for this test? O t10 O N(0,1) O to O ts
7. Suppose we want to test, at the 5% level of significance, whether there is a linear relationship between æ and y. That is, we want to test the null hypothesis Ho : B1 = 0 against the alternative hypothesis Ha : B1 7 0. What is the distribution of the test statistic for this test? O t10 O N(0,1) O to O ts

Functions and Change: A Modeling Approach to College Algebra (MindTap Course List)
6th Edition
ISBN:9781337111348
Author:Bruce Crauder, Benny Evans, Alan Noell
Publisher:Bruce Crauder, Benny Evans, Alan Noell
Chapter5: A Survey Of Other Common Functions
Section5.6: Higher-degree Polynomials And Rational Functions
Problem 1TU: The following fictitious table shows kryptonite price, in dollar per gram, t years after 2006. t=...

Related questions
Question
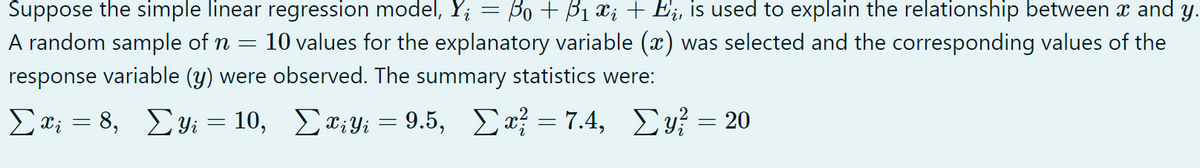
Transcribed Image Text:Suppose the simple linear regression model, Y; = Bo + B1 a; + Ej, is used to explain the relationship between x and y.
A random sample of n
10 values for the explanatory variable (x) was selected and the corresponding values of the
response variable (y) were observed. The summary statistics were:
Σ.8, Συ- 10 , Σα,y 9.5,
Σ-7.4, Σ-20
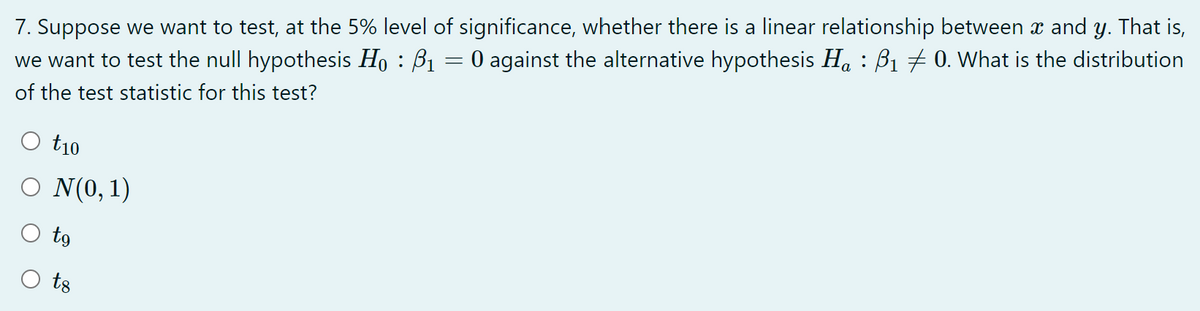
Transcribed Image Text:7. Suppose we want to test, at the 5% level of significance, whether there is a linear relationship between x and y. That is,
we want to test the null hypothesis Ho : B1 = 0 against the alternative hypothesis Ha : B1 7 0. What is the distribution
of the test statistic for this test?
t10
Ο Ν(0, 1)
t9
O ts
Expert Solution
This question has been solved!
Explore an expertly crafted, step-by-step solution for a thorough understanding of key concepts.

This is a popular solution!

Trending now
This is a popular solution!

Step by step
Solved in 2 steps

Recommended textbooks for you
Functions and Change: A Modeling Approach to Coll…
Algebra
ISBN:
9781337111348
Author:
Bruce Crauder, Benny Evans, Alan Noell
Publisher:
Cengage Learning
Functions and Change: A Modeling Approach to Coll…
Algebra
ISBN:
9781337111348
Author:
Bruce Crauder, Benny Evans, Alan Noell
Publisher:
Cengage Learning