1. SCP or SSxy= 2. SS,=. 3. SS,-

Functions and Change: A Modeling Approach to College Algebra (MindTap Course List)
6th Edition
ISBN:9781337111348
Author:Bruce Crauder, Benny Evans, Alan Noell
Publisher:Bruce Crauder, Benny Evans, Alan Noell
Chapter5: A Survey Of Other Common Functions
Section5.6: Higher-degree Polynomials And Rational Functions
Problem 1TU: The following fictitious table shows kryptonite price, in dollar per gram, t years after 2006. t=...

Related questions
Question
i need both images solved
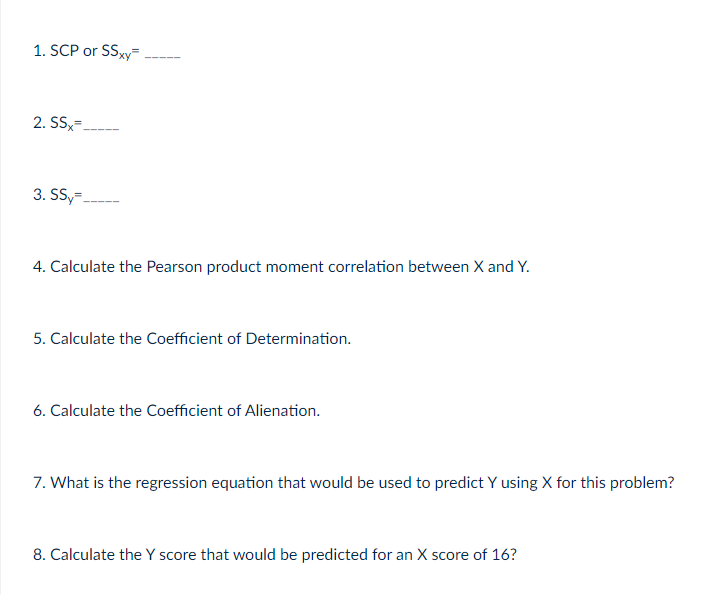
Transcribed Image Text:1. SCP or SSxy=
2. SS=.
3. SS,-
4. Calculate the Pearson product moment correlation between X and Y.
5. Calculate the Coefficient of Determination.
6. Calculate the Coefficient of Alienation.
7. What is the regression equation that would be used to predict Y using X for this problem?
8. Calculate the Y score that would be predicted for an X score of 16?
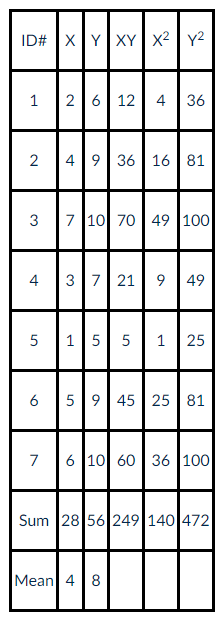
Transcribed Image Text:ID# XYXY| x2 | Y2
1
2 6 12
4
36
2
49 36 16 81
3
7 10 70 49 100
4
37 21| 9
49
5 15 5| 1 25
6 5 9 45 | 25 81
7
6 10 60 36 100
Sum 28 56 249 140 472
Mean 4 8
Expert Solution
This question has been solved!
Explore an expertly crafted, step-by-step solution for a thorough understanding of key concepts.

This is a popular solution!

Trending now
This is a popular solution!

Step by step
Solved in 2 steps with 2 images

Follow-up Questions
Read through expert solutions to related follow-up questions below.
Follow-up Question

Transcribed Image Text:4. Calculate the Pearson product moment correlation between X and Y.
5. Calculate the Coefficient of Determination.
6. Calculate the Coefficient of Alienation.
7. What is the regression equation that would be used to predict Y using X for this problem?
8. Calculate the Y score that would be predicted for an X score of 16?
Solution
Recommended textbooks for you
Functions and Change: A Modeling Approach to Coll…
Algebra
ISBN:
9781337111348
Author:
Bruce Crauder, Benny Evans, Alan Noell
Publisher:
Cengage Learning

College Algebra
Algebra
ISBN:
9781305115545
Author:
James Stewart, Lothar Redlin, Saleem Watson
Publisher:
Cengage Learning
Functions and Change: A Modeling Approach to Coll…
Algebra
ISBN:
9781337111348
Author:
Bruce Crauder, Benny Evans, Alan Noell
Publisher:
Cengage Learning
College Algebra
Algebra
ISBN:
9781305115545
Author:
James Stewart, Lothar Redlin, Saleem Watson
Publisher:
Cengage Learning