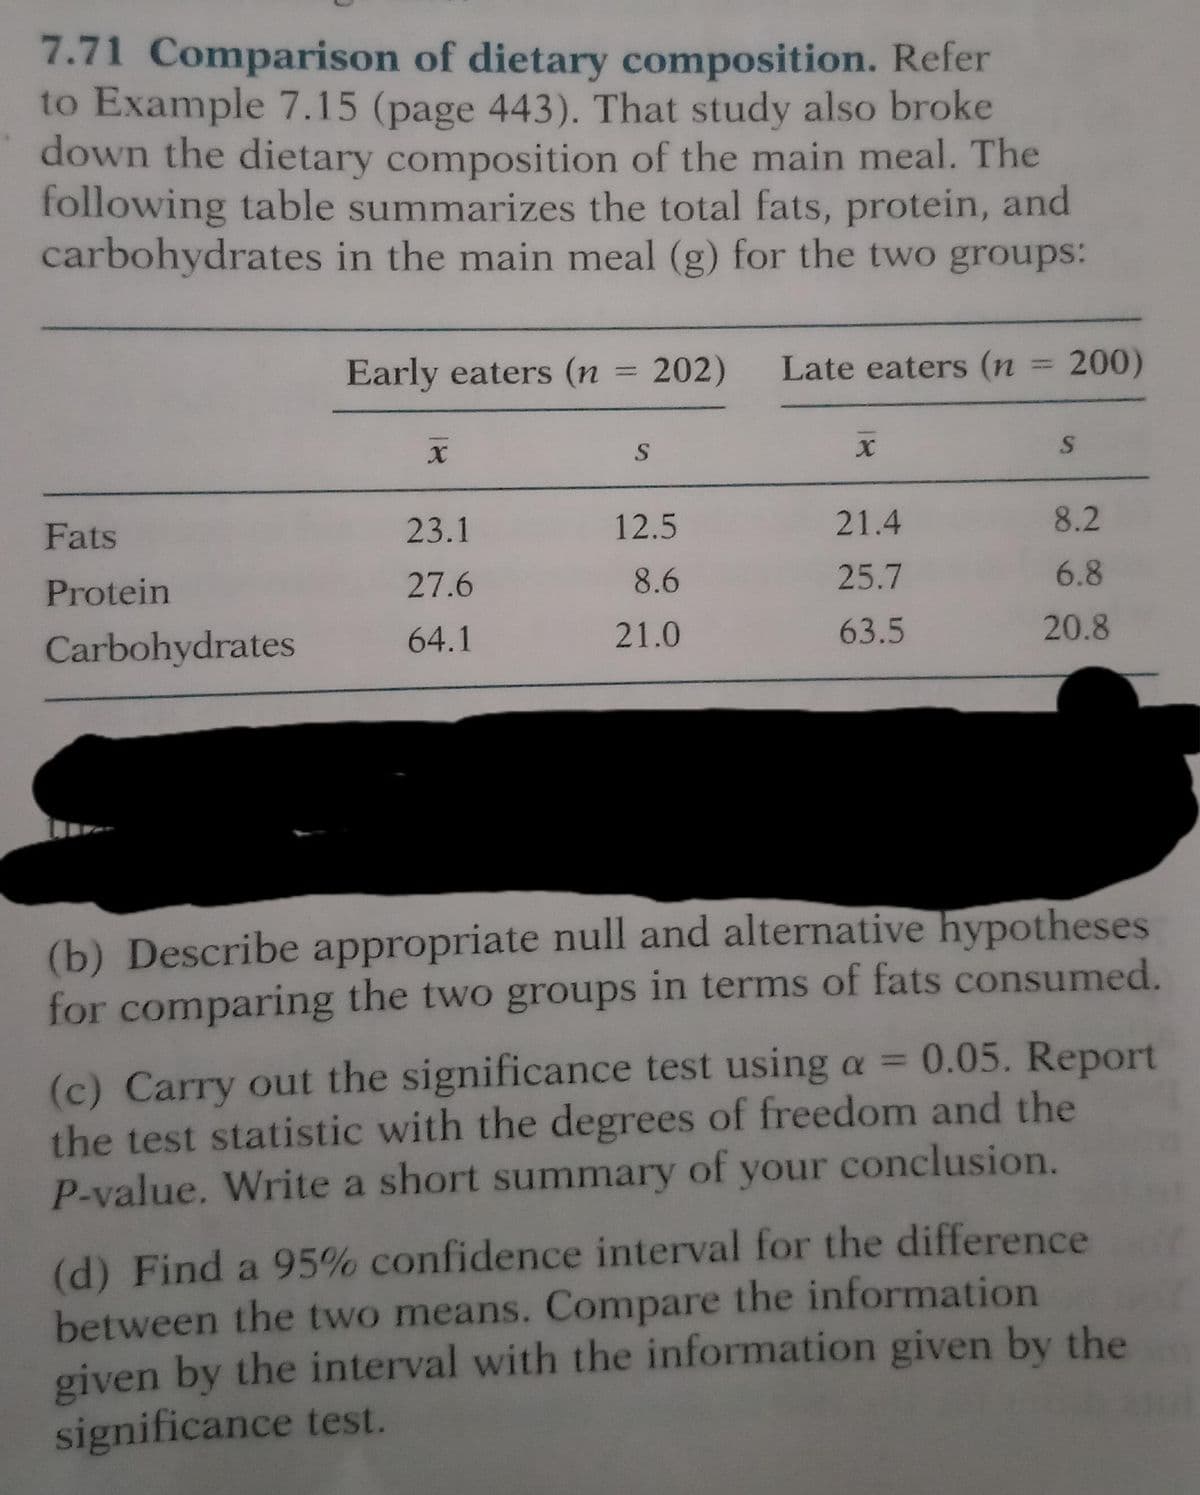
7.71 Comparison of dietary composition. Refer to Example 7.15 (page 443). That study also broke down the dietary composition of the main meal. The following table summarizes the total fats, protein, and carbohydrates in the main meal (g) for the two groups: Fats Protein Carbohydrates Early eaters (n 202) Late eaters (n X 23.1 27.6 64.1 S 12.5 8.6 21.0 21.4 25.7 63.5 200) S 8.2 6.8 20.8 (b) Describe appropriate null and alternative hypotheses for comparing the two groups in terms of fats consumed. (c) Carry out the significance test using a = 0.05. Report the test statistic with the degrees of freedom and the P-value. Write a short summary of your conclusion. (d) Find a 95% confidence interval for the difference between the two means. Compare the information given by the interval with the information given by the significance test.
Q: The Methods section of a research paper is where the researchers describe the statistical analyses…
A: True Explanation : In the methods section of research paper,you need to present your analysis that…
Q: Example 2.7 It is known that any item produced by a certain machine will be defective with…
A: Givenprobability of any item produced by a certain machine will be defective(p)=0.1sample…
Q: Explain Computing Variances by Conditioning.
A:
Q: A nutritionist wants to determine how much time nationally people spend eating and drinking. Suppose…
A: A) option A is the answer. Answer : Since the distribution of time spent eating and drinking each…
Q: A bag contains 4 white, 5 red and 6 blue balls. Three balls are drawn at random from the bag. The…
A: 4-white balls5-red balls6-blue balls 15- total balls three balls are drawn at random from the…
Q: State the properties of Co- variance;
A:
Q: A research study was conducted about gender differences in "sexting." The researcher believed that…
A: From the provided information, nB=2231xB=183nG=2169xG=156α=0.01
Q: regression line?
A: Regression equation is given by, Y= a+b*X where a is intercept (constant) and b is slope…
Q: When testing H: μ-μ ≤0 versus 1 1 2 H: µ-u > 0, the observed value of the Z- score was found to be -…
A:
Q: Virginia is selected and the number of people in attendance determined for each, describe completely…
A:
Q: The prices (in dollars) for a graphing calculator are shown below for 8 online vendors. Estimate the…
A: Given data is147,144,135,156,133,155,144,138sample size(n)=8confidence level=95%
Q: In testing a hypothesis about two population means, it the t distribution is used, which of the…
A:
Q: K Suppose a simple random sample of size n = 36 is obtained from a population with μ = 85 and o =…
A: A. Sample mean= population mean= 85 B. Sample standard deviation= 4
Q: A bag contains 4 white, 5 red and 6 blue balls. Three balls are drawn at random from the bag. The…
A:
Q: following output. Source | SS df MS Number of obs = 403…
A: From the above output Which of the following is the estimated regression line Y=17.86443+42.71867X
Q: he quality department at an electronics company has noted that, historically, 91% of the units of a…
A: From given data : 91% of the units of a specific product pass a test operation, 6% fail the test but…
Q: defective with probability 0.1, independently of any other item. What bability that in a sample of…
A: Given Probability of any item to be defective=0.1 Binominal repeat distribution (n) =3
Q: The acceptable level for insect filth in a certain food item is 4 insect fragments (larvae, eggs,…
A: Given: n = 50 X = 4.6 μ = 4 σ = 4
Q: If X; and independent, identically distributed (iid) Gaussian random variables with mean, μ, and…
A:
Q: The cost of attending your college has once again gone up. Although you have been told that…
A: Given information:…
Q: 2) Find d. Assume the samples are random and dependent, and the populations are normally…
A: Given Assume the samples are random and dependent, and the populations are normally distribution
Q: Last school year, the student body of a local university consisted of 30% freshmen, 24% sophomores,…
A: Given n=4 Df=3
Q: Often there are cheaper, less accurate tests for diagnosing the presence of some conditions in a…
A:
Q: Example 1.15 You know that a certain letter is equally likely to be in any one of three different…
A:
Q: The lifetime risk of developing pancreatic cancer is about one in 78 (1.28%). Suppose we randomly…
A: Given:- n = 200. p= 0.0128. X = number of people who will develop…
Q: 20. What are the Level of Measurement of the statistical variables? Nominal, Ratio, Interval, or…
A:
Q: Find the z-scores that separate the middle 10% of the distribution from the area in the tails of the…
A: Givenz-scores that separate Middle 10% of the distribution
Q: GIVEN A LARGE POPULATION WITH MEAN OF 75 AND STD DEVIATION OF 12 THE PROPABILITY THAT THE MEAN OF A…
A: From the provided information, Mean (µ) = 75 Standard deviation (σ) = 12 Sample size (n) = 36
Q: In the current chapter covering statistical inferences on means, all of the procedures we have…
A: Given that, Statistical inferences on means, all of the procedures have involved two assumptions.…
Q: C Use A = {3,4,7) and B={1,2,5,8) to find the set (An B) U (An B') within the universal set…
A:
Q: 7.4.5. Show that the first order statistic Y₁ of a random sample of size n from the distribution…
A: Solution: From the given information,
Q: A word consists of 9 letters; 5 consonants and 4 vowels.Three letters are choosen at random. What is…
A:
Q: Running Shoes. A shoe designer tests a new material for the soles of their most popular line of…
A: Given data: Runner New material wear Old material wear 1 1.14 1.03 2 1.04 0.87 3 1.08 0.96…
Q: A researcher claims that the number of homicide crimes by season is uniformly distributed. To test…
A: Null hypothesis: The number of homicide crimes by season is uniformly distributed (Claim).…
Q: LTE2 46 49% Suppose the lengths of the pregnancies of a certain animal are approximately normally…
A:
Q: Out of first 20 natural numbers, one number is selected at random. The probability that it is either…
A:
Q: Only about 18% of all people can wiggle their ears. Is this percent different for millionaires? Of…
A: Given that, p = 18% = 0.18 X = 48. and. N= 317 Formula used, the sample proportion is hat…
Q: simple random sample of front-seat occupants involved in car crashes is obtained. Among 2976…
A: Given n1=2976 x1=33 n2=7813 X2=10
Q: Find a 95% confidence interval for the difference between full attendance students' Exam 5 score and…
A:
Q: For the same sample proportion and sample size, what happens to the width of a confidence interval…
A: Solution-: For the same sample proportion and sample size, what happens to the width of a confidence…
Q: A professional sports organization is going to implement a test for steroids. The test gives a…
A: Given Null hypothesis: Ho: Steroid is not taken. Alternative hypothesis:H₁: Steroid is taken. 94%…
Q: Use the data given in problem 5 (page 325) to answer the following questions: (a) Test if the…
A: The required p-value for the given scenario is equal to 0.05.
Q: In a two-way data table, you can compare how different values of one input variable influence the…
A: Two way -variable data table shows how various combinations of 2 sets of variable values affect the…
Q: When testing for differences between the means of two related populations, what is the null…
A: given data test differences between means of two related populations.what will be null hypothesis?
Q: The following data represent the running times of films produced by 2 motion-picture companies: Co.…
A: The following information has been provided: 1 2 102 81 86 165 98 97 109 134 92 92…
Q: Information # 2: If a population has the following information: a mean equals 500 and a population…
A: Given that, mean = 500 and standard deviation = 100 We know that, z-score is given by, z-score =…
Q: The population of weights for men attending a local health club is normally distributed with a mean…
A: Since you have posted a question with multiple sub-parts, we will solve first three sub-parts for…
Q: What's test statistic and the p value?
A: The given hypothesis is H0:μ1=μ2 Versus H1:μ1>μ2.
Q: Imagine we draw a probability histogram for the number of heads if we toss a fair coin once. a)…
A: Introduction: The probability histogram of the number of heads obtained by tossing a fair coin once…
Q: The lifetime risk of developing pancreatic cancer is about one in 78 (1.28%). Suppose we randomly…
A:
Trending now
This is a popular solution!
Step by step
Solved in 4 steps with 4 images
- 1)In a cross-tabulation or contingency table examining the relationship between breed of dog and whether the dog passed certification to become a service animal, it is found that, overrall, 62 percent of the dogs were certified. The data looked at this for 6 breeds of dogs. If breed and being certified are independent of each other, about what percentage of each breed would pass the test? 2)Which of the following features must be present in a research design if the researchers want their data to demonstrate a causal relationship? The cause must take place before the effect. To the extent possible, another variable that explains the relationship needs to be ruled out or accounted for. The two variables need to covary. These three features must all be present. O A and B A correlation coefficient r provides two pieces of information about a relationship between two variables. These are Strength; direction of relationship Direction, proportionsAs part of a study on transportation safety, the US Department of Transportation collected data on the number of fatal accidents per 1000 licenses and the percentage of licensed drivers under the age of 21 in a sample of 42 cities. Data colletced over a one year period follow. These data are contained in the file Safety. PercentUnder 21 Fatal Accidentsper 1000 13 2.962 12 0.708 8 0.885 12 1.652 11 2.091 17 2.627 18 3.83 8 0.368 13 1.142 8 0.645 9 1.028 16 2.801 12 1.405 9 1.433 10 0.039 9 0.338 11 1.849 12 2.246 14 2.855 14 2.352 11 1.294 17 4.1 8 2.19 16 3.623 15 2.623 9 0.835 8 0.82 14 2.89 8 1.267 15 3.224 10 1.014 10 0.493 14 1.443 18 3.614 10 1.926 14 1.643 16 2.943 12 1.913 15 2.814 13 2.634 9 0.926 17 3.256 What is the value of the standard error of the estimate? Test for a significant relationship (show all appropriate steps). Use α = .05. In parts c and d, please give all appropriate…In the study described in the paper, "Exposure to Diesel Exhaust Induces Changes in EEG in Human Volunteers," 10 healthy mean were exposed to diesel exhaust for 1 hour. A measure of brain activity (called median power frequency, or MPF in Hz) was recorded at the same location in the brain both before and after the diesel exhaust exposure. The resulting data are given in the accompanying table. For purposes of this exercise, assume that the sample of 10 men is representative of healthy adult males. Subject 1 2 3 4 5 6 7 8 9 10 MPF Before (in HZ) 6.4 8.7 7.4 8.7 9.8 8.9 9.3 7.4 6.6 8.9 MPF After (in HZ) 8.0 12.6 8.4 9.0 8.4 11.0 14.4 11.3 7.1 11.2 Difference Construct and interpret a 90% confidence interval estimate for the difference in mean MPF before and after exposure to diesel exhaust.
- An automotive engineer is investigating two different types of metering devices for an electronic fuel injection system to determine whether they differ in their fuel mileage performance. The system is installed on 10 different cars, and a test is run with each metering device on each car. The data is provided below: Metering Device Car 1 2 1 17.6 16.8 2 19.4 20.0 3 18.2 17.6 4 17.1 16.4 5 15.3 16.0 6 15.9 15.9 7 16.3 16.5 8 18.0 18.4 9 17.3 16.4 10 19.1 20.1 Is there a significant difference between the means of the two metering devices? Use . Interpret the result in the context of the problem. An article in the journal Hazardous Waste and Hazardous Materials (Vol. 6, 1989) reported the results of an analysis of the weight of calcium in standard cement and cement doped with lead. Reduced levels of calcium would indicate that the hydration mechanism in the cement is blocked…The scientific productivity of major world cities was the subject of a recent study. The study determined the number of scientific papers published between 1994 and 1997 by researchers from each of the 20 world cities, and is shown below. City Number of papers City Number of papers City 1 1616 City 11 33 City 2 2626 City 12 99 City 3 1212 City 13 2121 City 4 55 City 14 44 City 5 22 City 15 55 City 6 2626 City 16 44 City 7 66 City 17 2020 City 8 2525 City 18 1717 City 9 1616 City 19 2222 City 10 66 City 20 2525 Construct a 95 % confidence interval for the average number of papers published in major world cities. blank <μ<blankThe table below shows the auto insurance quotes for two leading companies for a sample of 15 families. Assume the populations SDs are similar, but unknown. The President of the American Insurance Institute wants to compare the yearly costs of such insurance offered by the two companies. At the 0.10 level of significance, can we conclude that there is a difference in the amounts quoted? Families Southern Car American Mutual ($) ($) 1 2090 1610 2 1683 1247 3 1402 2327 4 1830 1367 5 930 1461 6 697 1789 7 1741 1621 8 1129 1914 9 1018 1956 10 1881 1772 11 1571 1375 12 874 1527 13 1579 1767 14 1577 1636 15 860 1188
- As part of a study on transportation safety, the U.S. Department of Transportation collected data on the number of fatal accidents per 1000 licenses and the percentage of licensed drivers under the age of 21 in a sample of 42 cities. Data collected over a one-year period follow. These data are contained in the file Safety. PercentUnder 21 Fatal Accidentsper 1000 13 2.962 12 0.708 8 0.885 12 1.652 11 2.091 17 2.627 18 3.83 8 0.368 13 1.142 8 0.645 9 1.028 16 2.801 12 1.405 9 1.433 10 0.039 9 0.338 11 1.849 12 2.246 14 2.855 14 2.352 11 1.294 17 4.1 8 2.19 16 3.623 15 2.623 9 0.835 8 0.82 14 2.89 8 1.267 15 3.224 10 1.014 10 0.493 14 1.443 18 3.614 10 1.926 14 1.643 16 2.943 12 1.913 15 2.814 13 2.634 9 0.926 17 3.256 d. Give a 95% interval estimate of the number of fatal accidents per 1000 licenses in a city where 15% of the licensed drivers are under 21.As part of a study on transportation safety, the U.S. Department of Transportation collected data on the number of fatal accidents per 1000 licenses and the percentage of licensed drivers under the age of 21 in a sample of 42 cities. Data collected over a one-year period follow. These data are contained in the file Safety. PercentUnder 21 Fatal Accidentsper 1000 13 2.962 12 0.708 8 0.885 12 1.652 11 2.091 17 2.627 18 3.83 8 0.368 13 1.142 8 0.645 9 1.028 16 2.801 12 1.405 9 1.433 10 0.039 9 0.338 11 1.849 12 2.246 14 2.855 14 2.352 11 1.294 17 4.1 8 2.19 16 3.623 15 2.623 9 0.835 8 0.82 14 2.89 8 1.267 15 3.224 10 1.014 10 0.493 14 1.443 18 3.614 10 1.926 14 1.643 16 2.943 12 1.913 15 2.814 13 2.634 9 0.926 17 3.256 a. What is the value of the standard error of the estimate? b. Test for a significant relationship (show all appropriate steps). Use α = .05. c. Give a 95% interval estimate of the…2.Researchers studied selenium levels in beef raised in a low selenium region of the United States. The goal of the study was to compare selenium levels in the region-raised beef to selenium levels in cooked venison, squirrel, and beef from other regions of the United States. The data in the Excel file (se_level.xlsx or se_level.txt) are the selenium levels calculated on a dry weight basis in mg=100 g for a sample of 53 region-raised cattle 11.23 29.63 20.42 10.12 39.91 32.66 38.38 36.21 16.39 27.44 17.29 56.20 28.94 20.11 25.35 21.77 31.62 32.63 30.31 46.16 56.61 24.47 29.39 40.71 18.52 27.80 19.49 15.82 27.74 22.35 34.78 35.09 32.60 37.03 27.00 44.20 13.09 33.03 9.69 32.45 37.38 34.91 27.99 22.36 22.68 26.52 46.01 38.04 30.88 30.04 25.91 18.54 25.51 Please answer the following questions: Use these data to construct: A…
- The table shows the lifetimes in hours of samples from three different types of plant species exposed to a pesticide. Determine whether there is a difference between the three types a significance level 0.01 Sample 1 457 461 459 Sample 2 454 456 458 455 452 Sample 3 460 458 456 458 What is the variation between treatment ?Fifteen adult males between the ages of 35 and 50 participated in a study to evaluate the effect of diet and exercise on blood cholesterol levels. The total cholesterol was measured in each subject initially and then three months after participating in an aerobic exercise program and switching to a low-fat diet. The data are shown in the following table.Is there a significant difference between the population means of group 1 and group 2 kindergarten children on a social perceptiveness measures at 0.05 level? Consider the data below Group 1 Group 2Mean 21.3 18.1Sd 5.8 7.5N 15 10