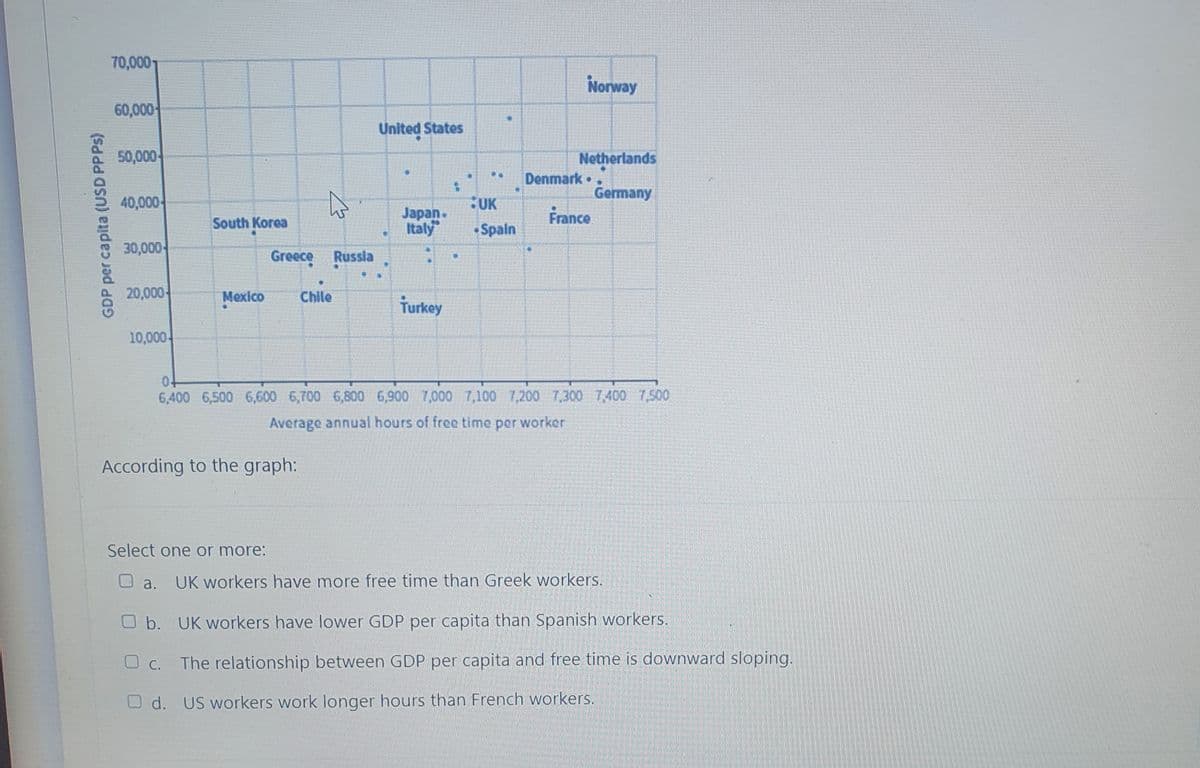
70,000T Norway 60,000 United States 50,000- Netherlands .3B Denmark • Germany France 40,000 UK Japan. Italy South Korea • Spain 30,000- Greece Russia 20,000 Mexico Chile Turkey 10,000- 6,400 6,500 6,600 6,700 6,800 6,900 7,000 7,100 7,200 7,300 7,400 7,500 Average annual hours of free time per worker According to the graph: Select one or more: O a. UK workers have more free time than Greek workers. O b. UK workers have lower GDP per capita than Spanish workers. The relationship between GDP per capita and free time is downward sloping. O c. O d. US workers work longer hours than French workers. GDP per capita (USD PPPS)
70,000T Norway 60,000 United States 50,000- Netherlands .3B Denmark • Germany France 40,000 UK Japan. Italy South Korea • Spain 30,000- Greece Russia 20,000 Mexico Chile Turkey 10,000- 6,400 6,500 6,600 6,700 6,800 6,900 7,000 7,100 7,200 7,300 7,400 7,500 Average annual hours of free time per worker According to the graph: Select one or more: O a. UK workers have more free time than Greek workers. O b. UK workers have lower GDP per capita than Spanish workers. The relationship between GDP per capita and free time is downward sloping. O c. O d. US workers work longer hours than French workers. GDP per capita (USD PPPS)

Principles of Economics 2e
2nd Edition
ISBN:9781947172364
Author:Steven A. Greenlaw; David Shapiro
Publisher:Steven A. Greenlaw; David Shapiro
Chapter12: Environmental Protection And Negative Externalities
Section: Chapter Questions
Problem 31CTQ: Consider two ways of protecting elephants from poachers in African countries. In one approach, the...

Related questions

Question
Transcribed Image Text:70,000
Norway
60,000
United States
50,000
Netherlands
Denmark •
Germany
France
40,000
UK
Japan.
Italy
South Korea
Spain
30,000-
Greece Russla
20,000
Mexico
Chile
Turkey
10,000-
6,400 6,500 6,600 6,700 6,800 6,900 7,000 7,100 7,200 7,300 7,400 7,500
Average annual hours of free time per worker
According to the graph:
Select one or more:
a.
UK workers have more free time than Greek workers.
Ob. UK workers have lower GDP per capita than Spanish workers.
O c. The relationship between GDP per capita and free time is downward sloping.
O d. US workers work longer hours than French workers.
GDP per capita (USD PPPS)
Expert Solution
This question has been solved!
Explore an expertly crafted, step-by-step solution for a thorough understanding of key concepts.

Step by step
Solved in 2 steps

Knowledge Booster


Learn more about
Need a deep-dive on the concept behind this application? Look no further. Learn more about this topic, economics and related others by exploring similar questions and additional content below.Recommended textbooks for you
Principles of Economics 2e
Economics
ISBN:
9781947172364
Author:
Steven A. Greenlaw; David Shapiro
Publisher:
OpenStax
Principles of Economics 2e
Economics
ISBN:
9781947172364
Author:
Steven A. Greenlaw; David Shapiro
Publisher:
OpenStax