71. The period B Set the constants A = 3, C = D = 0. a. Plot f(r) for the values B = 1, 3, 27, 57 over the interval -47 SIs 47. Describe what happens to the graph of the general sine function as the period increases. b. What happens to the graph for negative values of B? Try it with B = -3 and B = -27. 72. The horizontal shift C Setthe constants A = 3, B = 6, D = 0. a. Plot f(x) for the values C = 0, 1, and 2 over the interval -47 SIS 47. Describe what happens to the graph of the general sine function as C increases through positive values. b. What happens to the graph for negative values of C? c. What smallest positive value should be assigned to C so the graph exhibits no horizontal shift? Confirm your answer with a plot. 73. The vertical shift D Set the constants A = 3, B = 6, C = 0. a. Plot f(x) for the values D = 0, 1, and 3 over the interval -47 SxS 47. Describe what happens to the graph of the general sine function as D increases through positive values. b. What happens to the graph for negative values of D? 74. The amplitude A Set the constants B = 6, C = D = 0. a. Describe what happens to the graph of the general sine func- tion as A increases through positive values. Confirm your answer by plotting fx) for the values A = 1, 5, and 9. b. What happens to the graph for negative values of A?
71. The period B Set the constants A = 3, C = D = 0. a. Plot f(r) for the values B = 1, 3, 27, 57 over the interval -47 SIs 47. Describe what happens to the graph of the general sine function as the period increases. b. What happens to the graph for negative values of B? Try it with B = -3 and B = -27. 72. The horizontal shift C Setthe constants A = 3, B = 6, D = 0. a. Plot f(x) for the values C = 0, 1, and 2 over the interval -47 SIS 47. Describe what happens to the graph of the general sine function as C increases through positive values. b. What happens to the graph for negative values of C? c. What smallest positive value should be assigned to C so the graph exhibits no horizontal shift? Confirm your answer with a plot. 73. The vertical shift D Set the constants A = 3, B = 6, C = 0. a. Plot f(x) for the values D = 0, 1, and 3 over the interval -47 SxS 47. Describe what happens to the graph of the general sine function as D increases through positive values. b. What happens to the graph for negative values of D? 74. The amplitude A Set the constants B = 6, C = D = 0. a. Describe what happens to the graph of the general sine func- tion as A increases through positive values. Confirm your answer by plotting fx) for the values A = 1, 5, and 9. b. What happens to the graph for negative values of A?

Algebra & Trigonometry with Analytic Geometry
13th Edition
ISBN:9781133382119
Author:Swokowski
Publisher:Swokowski
Chapter6: The Trigonometric Functions
Section6.3: Trigonometric Functions Of Real Numbers
Problem 67E

Related questions
Topic Video
Question
COMPUTER EXPLORATIONS
In Exercises 71–74, you will explore graphically the general sine
function
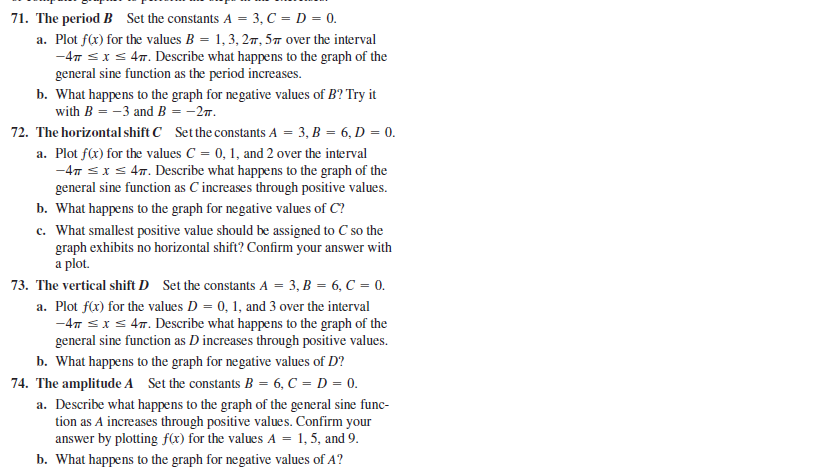
Transcribed Image Text:71. The period B Set the constants A = 3, C = D = 0.
a. Plot f(r) for the values B = 1, 3, 27, 57 over the interval
-47 SIs 47. Describe what happens to the graph of the
general sine function as the period increases.
b. What happens to the graph for negative values of B? Try it
with B = -3 and B = -27.
72. The horizontal shift C Setthe constants A = 3, B = 6, D = 0.
a. Plot f(x) for the values C = 0, 1, and 2 over the interval
-47 SIS 47. Describe what happens to the graph of the
general sine function as C increases through positive values.
b. What happens to the graph for negative values of C?
c. What smallest positive value should be assigned to C so the
graph exhibits no horizontal shift? Confirm your answer with
a plot.
73. The vertical shift D Set the constants A = 3, B = 6, C = 0.
a. Plot f(x) for the values D = 0, 1, and 3 over the interval
-47 SxS 47. Describe what happens to the graph of the
general sine function as D increases through positive values.
b. What happens to the graph for negative values of D?
74. The amplitude A Set the constants B = 6, C = D = 0.
a. Describe what happens to the graph of the general sine func-
tion as A increases through positive values. Confirm your
answer by plotting fx) for the values A = 1, 5, and 9.
b. What happens to the graph for negative values of A?
Expert Solution
This question has been solved!
Explore an expertly crafted, step-by-step solution for a thorough understanding of key concepts.

Step by step
Solved in 3 steps with 4 images

Knowledge Booster


Learn more about
Need a deep-dive on the concept behind this application? Look no further. Learn more about this topic, geometry and related others by exploring similar questions and additional content below.Recommended textbooks for you
Algebra & Trigonometry with Analytic Geometry
Algebra
ISBN:
9781133382119
Author:
Swokowski
Publisher:
Cengage

College Algebra (MindTap Course List)
Algebra
ISBN:
9781305652231
Author:
R. David Gustafson, Jeff Hughes
Publisher:
Cengage Learning
Algebra & Trigonometry with Analytic Geometry
Algebra
ISBN:
9781133382119
Author:
Swokowski
Publisher:
Cengage
College Algebra (MindTap Course List)
Algebra
ISBN:
9781305652231
Author:
R. David Gustafson, Jeff Hughes
Publisher:
Cengage Learning