75 The curve in space in which the plane z = c cuts a surface z = f(x, y) is made up of the points that represent the function value f(x, y) = c. It is called the contour curve f(x, y) = c to distinguish it from the level curve f(x, y) = c in the domain of f. Figure 14.6 shows the contour curve f(x, y) = 75 on the surface z = 100-ŕ-y defined by the function f(x, y) = 100-2²-². The contour curve lies directly above the circle x² + y² = 25, which is the level curve f(x, y) = 75 in the function's domain. The distinction between level curves and contour curves is often overlooked, and it is common to call both types of curves by the same name, relying on context to make it clear which type of curve is meant. On most maps, for example, the curves that represent con- stant elevation (height above sea level) are called contours, not level curves (Figure 14.7). Functions of Three Variables
75 The curve in space in which the plane z = c cuts a surface z = f(x, y) is made up of the points that represent the function value f(x, y) = c. It is called the contour curve f(x, y) = c to distinguish it from the level curve f(x, y) = c in the domain of f. Figure 14.6 shows the contour curve f(x, y) = 75 on the surface z = 100-ŕ-y defined by the function f(x, y) = 100-2²-². The contour curve lies directly above the circle x² + y² = 25, which is the level curve f(x, y) = 75 in the function's domain. The distinction between level curves and contour curves is often overlooked, and it is common to call both types of curves by the same name, relying on context to make it clear which type of curve is meant. On most maps, for example, the curves that represent con- stant elevation (height above sea level) are called contours, not level curves (Figure 14.7). Functions of Three Variables

Advanced Engineering Mathematics
10th Edition
ISBN:9780470458365
Author:Erwin Kreyszig
Publisher:Erwin Kreyszig
Chapter2: Second-order Linear Odes
Section: Chapter Questions
Problem 1RQ

Related questions
Question
Calculus 3 Functions of Several Variables; Limits and Continuity in Higher Dimensions
Question 1: Read the subsection “Graphs, Level Curves, and Contours of Functions of Two
Variables” (p. 809). Explain what a level curve is and how it’s related to the surface.
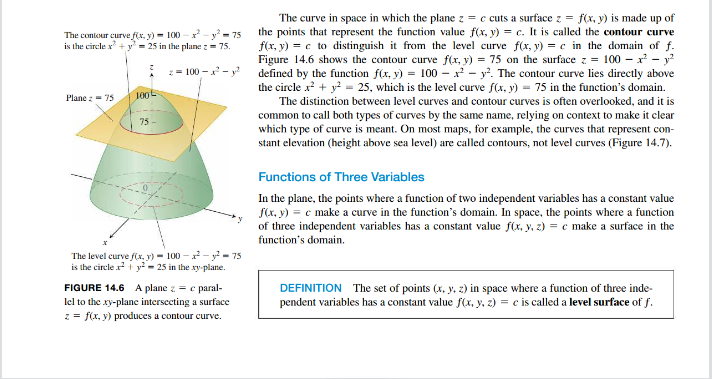
Transcribed Image Text:The contour curve f(x, y) = 100 - x² - y²-75
is the circle x² + y² = 25 in the plane z = 75.
z=100-²-²
Plane 75
100
75-
The level curve f(x, y) - 100-2²-²-75
is the circle x² + y² = 25 in the xy-plane.
FIGURE 14.6 A plane z = c paral-
lel to the xy-plane intersecting a surface
z = f(x, y) produces a contour curve.
The curve in space in which the plane z = c cuts a surface z = f(x, y) is made up of
the points that represent the function value f(x, y) = c. It is called the contour curve
f(x, y) = c to distinguish it from the level curve f(x, y) = c in the domain of f.
Figure 14.6 shows the contour curve f(x, y) = 75 on the surface z = 100x² - y²
defined by the function f(x, y) = 100x² - y². The contour curve lies directly above
the circle x² + y² = 25, which is the level curve f(x, y) = 75 in the function's domain.
The distinction between level curves and contour curves is often overlooked, and it is
common to call both types of curves by the same name, relying on context to make it clear
which type of curve is meant. On most maps, for example, the curves that represent con-
stant elevation (height above sea level) are called contours, not level curves (Figure 14.7).
Functions of Three Variables
In the plane, the points where a function of two independent variables has a constant value
f(x, y) = c make a curve in the function's domain. In space, the points where a function
of three independent variables has a constant value f(x, y, z) = c make a surface in the
function's domain.
DEFINITION The set of points (x, y, z) in space where a function of three inde-
pendent variables has a constant value f(x, y, z) = c is called a level surface of f.
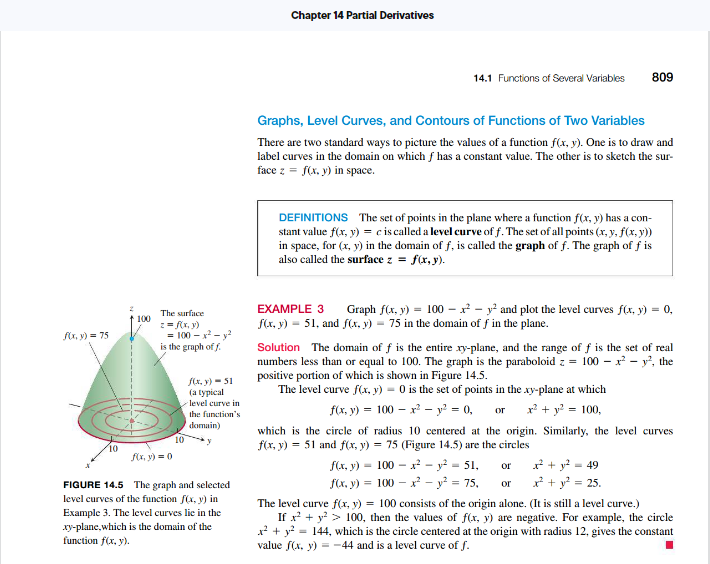
Transcribed Image Text:f(x, y) = 75
10
100
The surface
z=f(x, y)
= 100-x² - y²
is the graph off.
f(x, y) = 0
10
f(x,y)=51
(a typical
level curve in
the function's
domain)
FIGURE 14.5 The graph and selected
level curves of the function f(x, y) in
Example 3. The level curves lie in the
xy-plane, which is the domain of the
function f(x, y).
Chapter 14 Partial Derivatives
14.1 Functions of Several Variables 809
Graphs, Level Curves, and Contours of Functions of Two Variables
There are two standard ways to picture the values of a function f(x, y). One is to draw and
label curves in the domain on which f has a constant value. The other is to sketch the sur-
face z = f(x, y) in space.
DEFINITIONS The set of points in the plane where a function f(x, y) has a con-
stant value f(x, y) = c is called a level curve of f. The set of all points (x, y, f(x, y))
in space, for (x, y) in the domain of f, is called the graph of f. The graph of f is
also called the surface z = f(x, y).
EXAMPLE 3
Graph f(x, y) = 100x² - y² and plot the level curves f(x, y) = 0,
f(x, y) = 51, and f(x, y) = 75 in the domain off in the plane.
Solution The domain of f is the entire xy-plane, and the range of f is the set of real
numbers less than or equal to 100. The graph is the paraboloid z = 100x² - y², the
positive portion of which is shown in Figure 14.5.
The level curve f(x, y) = 0 is the set of points in the xy-plane at which
f(x, y) = 100x² - y² = 0, or x² + y² = 100,
which is the circle of radius 10 centered at the origin. Similarly, the level curves
f(x, y) = 51 and f(x, y) = 75 (Figure 14.5) are the circles
f(x, y) 100x² - y² = 51,
f(x, y) = 100x² - y² = 75,
²+²=49
x² + y² = 25.
or
The level curve f(x, y) = 100 consists of the origin alone. (It is still a level curve.)
If x² + y² > 100, then the values of f(x, y) are negative. For example, the circle
x² + y² = 144, which is the circle centered at the origin with radius 12, gives the constant
value f(x, y) = -44 and is a level curve of f.
or
Expert Solution
This question has been solved!
Explore an expertly crafted, step-by-step solution for a thorough understanding of key concepts.

Step by step
Solved in 3 steps with 2 images

Recommended textbooks for you
Advanced Engineering Mathematics
Advanced Math
ISBN:
9780470458365
Author:
Erwin Kreyszig
Publisher:
Wiley, John & Sons, Incorporated

Numerical Methods for Engineers
Advanced Math
ISBN:
9780073397924
Author:
Steven C. Chapra Dr., Raymond P. Canale
Publisher:
McGraw-Hill Education

Introductory Mathematics for Engineering Applicat…
Advanced Math
ISBN:
9781118141809
Author:
Nathan Klingbeil
Publisher:
WILEY
Advanced Engineering Mathematics
Advanced Math
ISBN:
9780470458365
Author:
Erwin Kreyszig
Publisher:
Wiley, John & Sons, Incorporated
Numerical Methods for Engineers
Advanced Math
ISBN:
9780073397924
Author:
Steven C. Chapra Dr., Raymond P. Canale
Publisher:
McGraw-Hill Education
Introductory Mathematics for Engineering Applicat…
Advanced Math
ISBN:
9781118141809
Author:
Nathan Klingbeil
Publisher:
WILEY

Mathematics For Machine Technology
Advanced Math
ISBN:
9781337798310
Author:
Peterson, John.
Publisher:
Cengage Learning,

