77 81 85 89 93 97 101 Based on the graph of this normal distribution, a. The mean is b. The standard deviation is C. 68% of the data values are between and d. 95% of the data values are between and and e. 99.7% of the data values are between

Q: According to the empirical rule for population data that form a normal distribution, what percentage…
A:
Q: B. In a given normal distribution, the population means is 80 and the population standard deviation…
A:
Q: The graph illustrates a normal distribution for the prices paid for a television. The mean price…
A: Given Information: Mean μ=1200 Standard deviation σ=100 Using Empirical Rule: (a) To find the…
Q: Test scores for a given class are normally distributed with a mean of 80 and standard deviation 14.…
A:
Q: Approximately how much area under a normal curve falls between +1 standard deviations? O 95% O…
A: Empirical Rule: It is clear that is used for normal distribution with the specified value of mean…
Q: The graph illustrates a normal distribution for the prices paid for a particular model of HD…
A: Given that The graph illustrates the normal distribution with Mean (μ) = $1800 Standard deviation…
Q: A simple random sample of 100 observations was taken from a large population (N > 10,000). The…
A:
Q: 3. In the United States, the prices of wedding cakes follow a Normal distribution, with a mean of…
A: Given data: Mean = $ 540 Standard deviation = $115 To find: What percentage of wedding cakes in…
Q: The graph illustrates a normal distribution for the prices paid for a particular model of HD…
A: Hi, thanks for posting the question. Since there are more than three sub parts posted in the…
Q: 60 63 66 69 72 75 There are n = 100 data points included in the dotplot. Estimate the mean and the…
A: Given data, The data is…
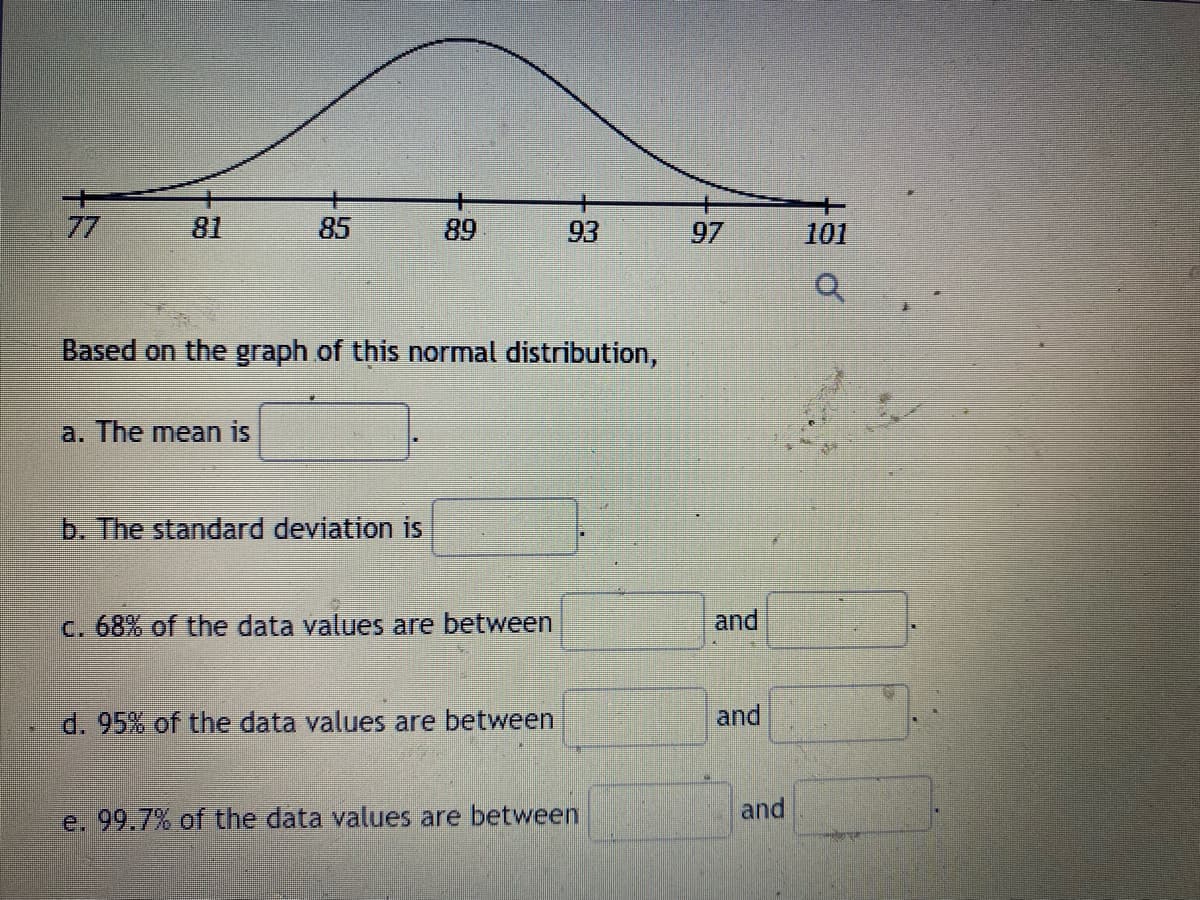
Q: + 77 81 85 89 93 97 101 Based on the graph of this normal distribution, a. The mean is b. The…
A: From the given graph we know that μ=89μ+σ=93........1μ-σ=85.........2μ+2σ=97μ-2σ=81μ+3σ=101μ-3σ=77
Q: Two hundred pre-engineering students have their midterm grades in the statistics, assuming normally…
A: GivenMean(μ)=2.2standard deviation(σ)=0.6
Q: In a certain normal distribution, find the standard deviation o when p = 50 and 10.56% of the area…
A: Let, the random variable X follows Normal distribution Mean = μ = 50 The area lies to the right of…
Q: 20. The mean age (at inauguration) of all U.S. Presidents is approximately Normally distributed with…
A: Given ,mean (μ)=54.6
Q: 4) The length of time it takes college students to find a parking spot in the library parking lot…
A: find z score for given interval : here,
Q: 16. In a standardized test with a normal distribution of scores, the mean is 63 and the standard…
A:
Q: For a normal distribution with a mean of μ = 100 and a standard deviation of σ = 15, what is…
A: From the provided information, Mean (µ) = 100 Standard deviation (σ) = 15 X~N (100, 15)
Q: 86 90 94 98 102 106 Based on the graph of this normal distribution, a. The mean is b. The standard…
A: Since you have posted a question with multiple sub-parts, we will solve first three subparts for…
Q: 12. A normal distribution has a mean of µ = 70 and a standard deviation of o = 8. For each of the…
A: Hey there! Thank you for posting the question. Since your question has more than 3 parts, we are…
Q: Test scores for a given class are normally distributed with a mean of 80 and standard deviation 14.…
A: Given that, the test score is normally distributed with mean,μ=80 and standard…
Q: Test scores for a given class are normally distributed with a mean of 80 and standard deviation 14.…
A:
Q: What is the probability that a data value in a normal distribution is between a Z-score of -1.42 and…
A: Let Z be the random variable from normal distribution then we will find the probability between z =…
Q: 1.6.Find the corresponding standard score of the following values: a. 88 b. 86 c. 92 d. 94
A: Here given Mean = 90 Standard deviation = 1.6 Use z score formula here
Q: Find the indicated probability. 9) The incomes of trainees at a local mill are normally distributed…
A: It is given that the mean is 1100 and standard deviation is 150.
Q: In a normal distribution, x = 6 and z = 1.25. This tells you that x = 6 is ____ standard deviations…
A: It is given that Value x = 6 Z-score = 1.25
Q: 1) How many percent of a normal distribution curve falls within 2 standard deviation from the mean?…
A: It is given that the normal curve falls within 2 standard deviations from the mean.
Q: d. The 90th percentile of a normal distribution is how many standard deviations above the mean? e.…
A: a) Let X represent the normal distribution P(X<y)=0.9P(z<y-μσ)=0.9Using standard normal…
Q: A commonly used test of intelligence (IQ) results in a normal distribution with a mean of 100 and a…
A: Given information Mean µ = 100 Standard deviation σ = 15
Q: A normal distribution has a population mean of u=75 and a standard deviation of o=9. What is the…
A:
Q: A population data set has a normal distribution has a mean u = 28 and a standard deviation o = 4.2.…
A:
Q: In an exam attended by 600 people, the average of the grades is 60 and the standard deviation is…
A:
Q: 14. A normal distribution has a mean of µ = 50 and a standard deviation of o = 5. For each of the…
A: It is given that the mean is 50 and the standard deviation is 5.
Q: The annual per capita consumption of ice cream (in pounds) in the United States can be approximated…
A: Given : μ = 17.4σ = 4.8
Q: 30 41 52 63 74 85 96 Based on the graph of this normal distribution, a. The mean is c. The mode is…
A: For a normal distribution we know that mean=median=mode.
Q: 69 78 87 96 105 114 Based on the graph of this normal distribution, a. The mean is b. The median is…
A: Given graph is
Q: For a normal distribution, given a standard deviation of 3.8 and a mean of 54, what percent lies…
A:
Q: A data set has a normal distribution with a mean of 100 and a standard deviation of 10. VWhat…
A: We have to find correct answer for given question...
Q: The mean and standard deviation of a normal distribution are given below. H = 78.2 O = 2.8…
A: empirical rules:1) P(μ-σ<X<μ+σ)=68%2) P(μ-2σ<X<μ+2σ)=95%3) P(μ-3σ<X<μ+3σ)=99.7%
Q: 10. Suppose a normal distribution has a normal distribution with a u = 25 and a standard deviation o…
A: GivenMean(μ)=25standard deviation(σ)=5
Q: The graph of a normal curve is given below. -7-4 -1 2 8. 8 11 X The value of the mean () is and the…
A: As the given graph is stated to be normal, and we know in the normal distribution,…
Q: The graph shows the distribution of times (in hours) that teenagers spend playing video games per…
A:
Q: 14 26 38 50 62 74 86 Based on the graph of this normal distribution, a. The mean is b. The standard…
A:
Q: What is the probability that a data value in a normal distribution is between a z-score of -1.13 and…
A: Given that. X~N( 0 , 1 ) μ=0 , ?=1 (for standard normal distribution) Z-score =( x - μ )/?
Q: The graph shows the distribution of times (in hours) that teenagers spend playing video games per…
A: Solution: Let X be the time that teenager spend playing video games per week. From the given…
Q: A normal distribution has a mean of 132 with a standard deviation of 28. By the Empirical Rule…
A: Since you have asked multiple question, we will solve the first question for you. If you want any…
Q: A commonly used test of intelligence (IQ) results in a normal distribution with a mean of 100 and a…
A: This problem can be solved by finding z value. Given: Mean = 100 SD = 15 and 70 < x < 130
Q: A population data set with a normal distribution has a mean µ = 4 and a standard deviation o = 1.1.…
A: According to the given information, we have Mean = 4 Standard deviation = 1.1
Q: The lengths in minutes of feature films for the current year follow a normal distribution with a…
A: According to the given information, we have The distribution is normal. Mean = 109 minutes Standard…
Q: The test scores for the analytical writing section of a particular standardized test can be…
A: Given that μ=3.3,σ=0.92 (a) The maximum score that can be in the bottom 20% is, Thus, the maximum…
Q: Solve the problem. 10) For a standard normal distribution, find. the percentage of data that are…
A:

Step by step
Solved in 2 steps with 3 images
