The graph illustrates a normal distribution for the prices paid for a particular model of HD television. The mean price paid is $1800 and the standard deviation is $65. 1605 1670 1735 1800 1865 1930 1995 Distribution of Prices
The graph illustrates a normal distribution for the prices paid for a particular model of HD television. The mean price paid is $1800 and the standard deviation is $65. 1605 1670 1735 1800 1865 1930 1995 Distribution of Prices

Big Ideas Math A Bridge To Success Algebra 1: Student Edition 2015
1st Edition
ISBN:9781680331141
Author:HOUGHTON MIFFLIN HARCOURT
Publisher:HOUGHTON MIFFLIN HARCOURT
Chapter11: Data Analysis And Displays
Section: Chapter Questions
Problem 11CR

Related questions
Question
Transcribed Image Text:Lower endpoint: 58
Upper endpoint: 92
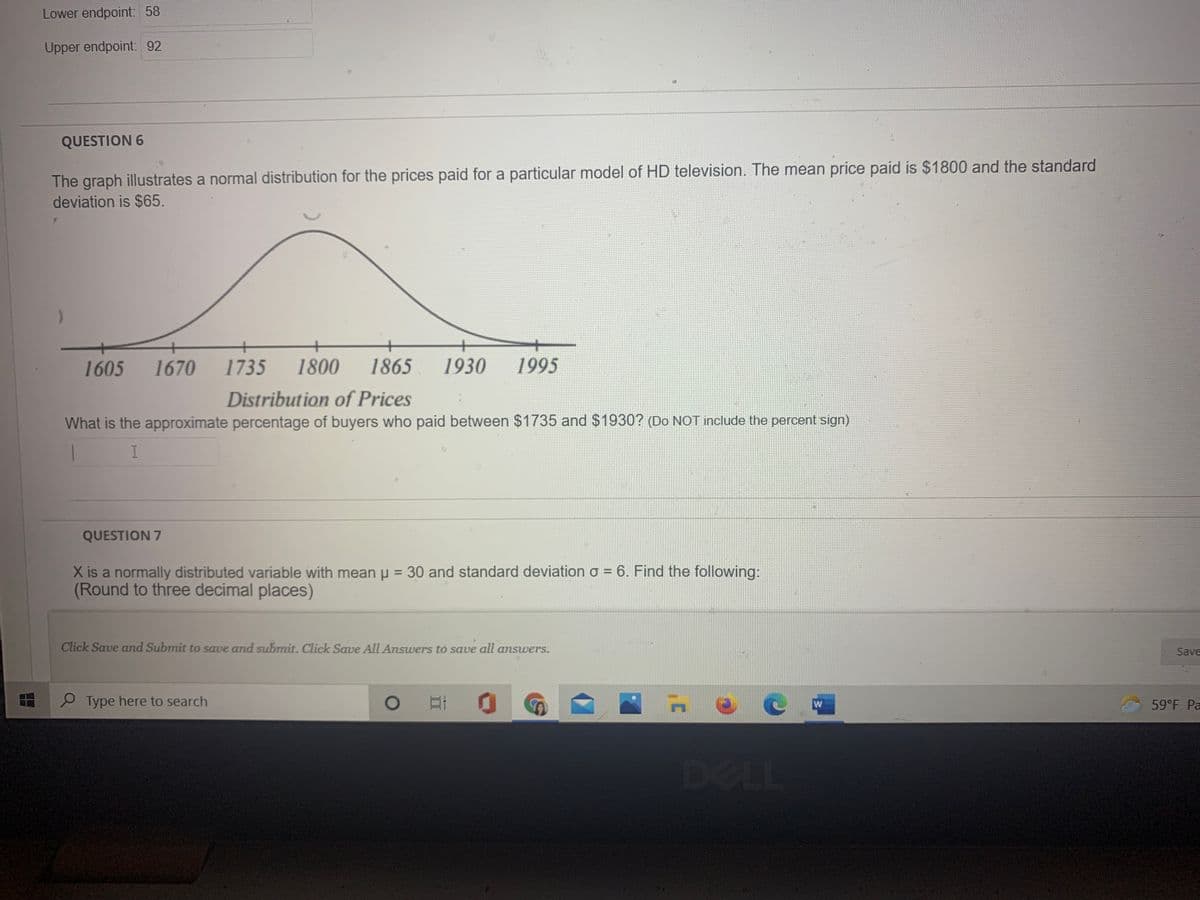
QUESTION 6
The graph illustrates a normal distribution for the prices paid for a particular model of HD television. The mean price paid is $1800 and the standard
deviation is $65.
1605
1670
1735
1800
1865
1930
1995
Distribution of Prices
What is the approximate percentage of buyers who paid between $1735 and $1930? (Do NOT include the percent sign)
QUESTION 7
X is a normally distributed variable with mean p = 30 and standard deviation o = 6. Find the following:
(Round to three decimal places)
Click Save and Submit to save and submit. Click Save All Answers to save all answers.
Save
P Type here to search
59°F Pa
DELL
Expert Solution
This question has been solved!
Explore an expertly crafted, step-by-step solution for a thorough understanding of key concepts.

This is a popular solution!

Trending now
This is a popular solution!

Step by step
Solved in 3 steps

Recommended textbooks for you
Big Ideas Math A Bridge To Success Algebra 1: Stu…
Algebra
ISBN:
9781680331141
Author:
HOUGHTON MIFFLIN HARCOURT
Publisher:
Houghton Mifflin Harcourt
Big Ideas Math A Bridge To Success Algebra 1: Stu…
Algebra
ISBN:
9781680331141
Author:
HOUGHTON MIFFLIN HARCOURT
Publisher:
Houghton Mifflin Harcourt