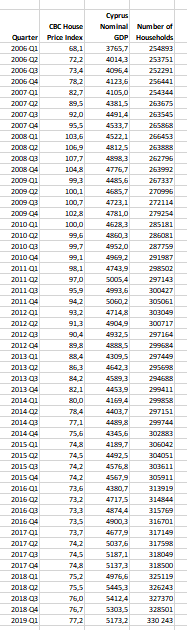
78,2 41216 82.7 4105.0 43815 920 44914 955 4531,7 1016 4522.1 1069 48125 107,7 1048 4776,7 4456 100,1 100,7 4721,1 1028 47810 100,0 996 4628.1

Linear Algebra: A Modern Introduction
4th Edition
ISBN:9781285463247
Author:David Poole
Publisher:David Poole
Chapter7: Distance And Approximation
Section7.3: Least Squares Approximation
Problem 31EQ
icon
Related questions
icon
Concept explainers
Question
100%
Cyprus
CBC House
Nominal Number of
Quarter
Price Index
GDP Houscholds
2005 01
68,1
3765,7
254893
2006 02
72,2
4014.3
253751
2005 Q3
73,4
4096,4
252291
2005 04
78,2
4123,6
256441
2007 Q1
827
4105,0
254344
2007 a2
895
4381,5
263675
2007 03
92,0
4491,4
263545
2007 04
95,5
4533.7
265868
2008 Q1
101,6
4522,1
265453
2008 2
105,9
4812,5
263888
2008 3
107,7
4898.3
262796
2008 04
104,8
4776,7
263992
2009 01
99.3
4485,6
267337
2009 02
100,1
4685,7
270996
2009 a
100,7
4723,1
272114
2009 04
102,8
4781,0
279254
2010 01
100.0
4628.3
285181
2010 a2
99,6
4850,3
285081
2010 03
99,7
4952,0
287759
2010 04
99,1
4992
291987
201101
98,1
4743.9
298502
2011 02
97,0
5005,4
297143
2011 03
95,9
4993,6
300427
2011 04
94,2
SO60,2
30s061
2012 01
93,2
4714.8
303049
2012 02
91,3
4904,9
300717
2012 03
90.4
4932,5
297164
2012 04
89,8
4888,5
299684
2013 01
88,4
4309,5
297449
2013 02
86,3
4642.3
295698
2013 03
842
4589,3
294688
2013 04
82,1
4453,9
299411
2014 Q1
30,0
4169,4
299858
2014 02
78,4
4403,7
297151
2014 03
77,1
4489,8
299744
2014 04
75,6
4345,6
302883
2015 Q1
74,8
4189,7
305042
2015 02
74,5
4492.5
304051
2015 03
74,2
4576,8
303611
2015 04
74,2
4567,9
305911
2016 Q1
73,6
4380,7
313919
2016 02
73,2
4717,5
314844
2016 03
73,3
4874,4
315769
2016 04
73,5
4900,3
316701
2017 Q1
73,7
4677,9
317149
2017 02
74,2
SO37,5
317598
2017 03
74,5
5187,1
318049
2017 04
74,8
5137,3
318500
2018 Q1
75,2
4976.6
325119
2018 2
75,5
5445,3
326243
2018 Q
76,0
5412,4
327370
53015
5173,2
2018 04
76,7
328501
2019 01
772
330 243
Transcribed Image Text:Cyprus CBC House Nominal Number of Quarter Price Index GDP Houscholds 2005 01 68,1 3765,7 254893 2006 02 72,2 4014.3 253751 2005 Q3 73,4 4096,4 252291 2005 04 78,2 4123,6 256441 2007 Q1 827 4105,0 254344 2007 a2 895 4381,5 263675 2007 03 92,0 4491,4 263545 2007 04 95,5 4533.7 265868 2008 Q1 101,6 4522,1 265453 2008 2 105,9 4812,5 263888 2008 3 107,7 4898.3 262796 2008 04 104,8 4776,7 263992 2009 01 99.3 4485,6 267337 2009 02 100,1 4685,7 270996 2009 a 100,7 4723,1 272114 2009 04 102,8 4781,0 279254 2010 01 100.0 4628.3 285181 2010 a2 99,6 4850,3 285081 2010 03 99,7 4952,0 287759 2010 04 99,1 4992 291987 201101 98,1 4743.9 298502 2011 02 97,0 5005,4 297143 2011 03 95,9 4993,6 300427 2011 04 94,2 SO60,2 30s061 2012 01 93,2 4714.8 303049 2012 02 91,3 4904,9 300717 2012 03 90.4 4932,5 297164 2012 04 89,8 4888,5 299684 2013 01 88,4 4309,5 297449 2013 02 86,3 4642.3 295698 2013 03 842 4589,3 294688 2013 04 82,1 4453,9 299411 2014 Q1 30,0 4169,4 299858 2014 02 78,4 4403,7 297151 2014 03 77,1 4489,8 299744 2014 04 75,6 4345,6 302883 2015 Q1 74,8 4189,7 305042 2015 02 74,5 4492.5 304051 2015 03 74,2 4576,8 303611 2015 04 74,2 4567,9 305911 2016 Q1 73,6 4380,7 313919 2016 02 73,2 4717,5 314844 2016 03 73,3 4874,4 315769 2016 04 73,5 4900,3 316701 2017 Q1 73,7 4677,9 317149 2017 02 74,2 SO37,5 317598 2017 03 74,5 5187,1 318049 2017 04 74,8 5137,3 318500 2018 Q1 75,2 4976.6 325119 2018 2 75,5 5445,3 326243 2018 Q 76,0 5412,4 327370 53015 5173,2 2018 04 76,7 328501 2019 01 772 330 243
b. Add in the table provided in the spreadsheet a dummy variable that takes
the value of 1in the fourth quarter of each year and show the table with
all the data
c. Using the data provided in the spreadsheet including the dummy variable
you have created for the fourth quarter of each year run a regression with
dependent variable the CBC house price index and independent variables
the other three variables (Nominal GDP, Number of Households, and the
dummy variable for the fourth quarter). Present the typical regression
results output for this regression produced by Excel.
d. Explain what the particular numbers for the following statistics that you
presented in b) mean (no points will be given if you write general
definitions without interpreting the particular numbers that you have
presented):
a. R-squared
b. The t-statistics of the three independent variables
c. The coefficients of the three independent variables
e. Discuss if the signs that you get for the coefficients of each of the three
independent variables are correct or wrong and why
f. Write the house price index equation that can be constructed on the basis
of the estimated constant and the coefficients of the three independent
variables
g. Estimate/forecast the CBC house price index for the first quarter of 2021
assuming that the nominal GDP in the first quarter of 2021 was lower by
1.3% than its 2019-Q1 value and the number of households was higher
than its 2019-Q1 value by 1.6%. Show and explain clearly the
calculations by which you derived your answer.
h. Estimate/forecast the CBC house price index for the fourth quarter of
2021 assuming that the nominal GDP in the fourth quarter of 2021 will be
higher than its 2019-Q1 value by 2% and that the number of households
will be higher than its 2019-Q1 value by 3%. Show and explain clearly
the calculations by which you derived your answer.
Transcribed Image Text:b. Add in the table provided in the spreadsheet a dummy variable that takes the value of 1in the fourth quarter of each year and show the table with all the data c. Using the data provided in the spreadsheet including the dummy variable you have created for the fourth quarter of each year run a regression with dependent variable the CBC house price index and independent variables the other three variables (Nominal GDP, Number of Households, and the dummy variable for the fourth quarter). Present the typical regression results output for this regression produced by Excel. d. Explain what the particular numbers for the following statistics that you presented in b) mean (no points will be given if you write general definitions without interpreting the particular numbers that you have presented): a. R-squared b. The t-statistics of the three independent variables c. The coefficients of the three independent variables e. Discuss if the signs that you get for the coefficients of each of the three independent variables are correct or wrong and why f. Write the house price index equation that can be constructed on the basis of the estimated constant and the coefficients of the three independent variables g. Estimate/forecast the CBC house price index for the first quarter of 2021 assuming that the nominal GDP in the first quarter of 2021 was lower by 1.3% than its 2019-Q1 value and the number of households was higher than its 2019-Q1 value by 1.6%. Show and explain clearly the calculations by which you derived your answer. h. Estimate/forecast the CBC house price index for the fourth quarter of 2021 assuming that the nominal GDP in the fourth quarter of 2021 will be higher than its 2019-Q1 value by 2% and that the number of households will be higher than its 2019-Q1 value by 3%. Show and explain clearly the calculations by which you derived your answer.
Expert Solution
steps

Step by step

Solved in 3 steps

Blurred answer
Knowledge Booster
Continuous Probability Distribution
Learn more about
Need a deep-dive on the concept behind this application? Look no further. Learn more about this topic, statistics and related others by exploring similar questions and additional content below.
Recommended textbooks for you
Linear Algebra: A Modern Introduction
Algebra
ISBN:
9781285463247
Author:
David Poole
Publisher:
Cengage Learning
College Algebra
College Algebra
Algebra
ISBN:
9781337282291
Author:
Ron Larson
Publisher:
Cengage Learning
Glencoe Algebra 1, Student Edition, 9780079039897…
Algebra
ISBN:
9780079039897
Author:
Carter
Publisher:
McGraw Hill
Big Ideas Math A Bridge To Success Algebra 1: Stu…
Algebra
ISBN:
9781680331141
Author:
HOUGHTON MIFFLIN HARCOURT
Publisher:
Houghton Mifflin Harcourt
Holt Mcdougal Larson Pre-algebra: Student Edition…
Algebra
ISBN:
9780547587776
Author:
HOLT MCDOUGAL
Publisher:
HOLT MCDOUGAL