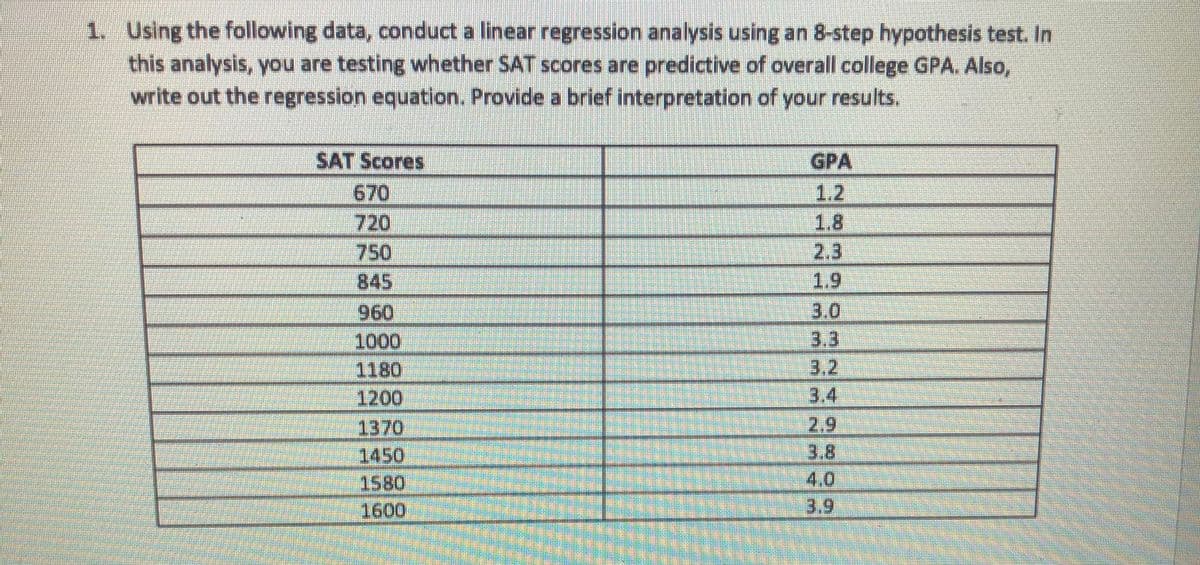
Using the following data, conduct a linear regression analysis using an 8-step hypothesis test. In this analysis, you are testing whether SAT scores are predictive of overall college GPA. Also, write out the regression equation. Provide a brief interpretation of your results. SAT Scores GPA 670 1.2 720 1.8 750 2.3 845 1.9 960 3.0 1000 3.3 1180 3.2 1200 3.4 1370 2.9 1450 3.8 1580 4.0 1600 3.9


Q: Lef x~N(U,0*), Show that the MGF x is etHifto? of 13
A:
Q: Men versus women The National Assessment of Educational Progress (NAEP) Young Adult Literacy…
A: There are two independent samples which are men and women. We have to test whether the difference…
Q: (a) What are the null hypothesis H. and the alternative hypothesis H, that should be used for μ the…
A: Null and alternative hypotheses: Null hypothesis: Null hypothesis is a statement which is tested for…
Q: 3. 8. 10 A researcher wishes to estimate the proportion of X-ray machines that malfunction. A random…
A:
Q: Given: Margin of error (d)= 2.19, Confidence interval (CI) of population mean = 90%, and population…
A: Given that Population standard deviation =5 Margin of error =d=2.19 90% confidence.
Q: What is the value of the finite population correction factor given a population consisting of 2, 3,…
A: Given that What is the value of the finite population correction factor given a population…
Q: An opaque bag contains 3 green marbles and 3 red marbles. Two marbles are randomly drawn one at a…
A:
Q: The volume of water in swimming pools in a local neighborhood is normally distributed. What is the…
A:
Q: 3. A select life aged 40 purchases a 10-year endowment insurance with $100,000 sum insured. Premiums…
A:
Q: A manufacturer claims that the batteries for a laptop can last up to 6 hours from full charge. State…
A: A manufacturer claims that the batteries for a laptop can last up to 6 hours from full charge.
Q: = (heights) above: s, April 2014). TI oon's size based n using simple lin
A: A study of measuring Moon's orbit has given.
Q: The annual salaries of employees in a large company are normally distributed with a mean of $55,000…
A:
Q: the damage in each case was assessed, and the relevant data are shown in the accompanying table;…
A: Anova is used to measure the mean significant difference between the three or more variable. It is a…
Q: Answer the multiple choice. A sample of size 50 will be drawn from a population with mean 73 and…
A:
Q: You are testing the claim that the proportion of men who own cats is larger than the proportion of…
A:
Q: For each item, identify if the type of sample is related or independent. 1. Prof. Antonio believes…
A: Hello! As you have posted 2 different questions, we are answering the first question. In case you…
Q: The national distribution of fatal work injuries in a country is shown in the table to the right…
A:
Q: Let X be a random variable with mean u and variance o?, and suppose that its moment- generating…
A: Let X be a random variable with mean μ and variance σ2. The probability density function of the…
Q: Ex-6 A class has 10 students. Each student has a birthday which can be one of the 365 days of the…
A:
Q: For each item, identify if the type of sample is related or independent. 1. Prof. Antonio believes…
A: Hello! As you have posted 2 different questions, we are answering the first question. In case you…
Q: 5. Help Aunt May in answering some problems about independent events. Consider generating a random…
A: Given Information: An experiment involves generating a random three-bit string. Event A is that the…
Q: the histogram below. NOTE: The last class actually represents "7 or more items," not just 7 items.
A: The histogram can be denoted as,
Q: The average number of liters of fresh milk that a person consumes in a month is 18 liters. Assume…
A: Given that. X~N( μ , ?^2 ) μ=18 , ?=4.5 , n=32 Z-score =( x - μ )/?
Q: n the election a state representative received 52% of the votes cast. One year after the election,…
A: Given that n=300 , p=52%=0.52 , q=1-p=1-0.52=0.48 Find P(X>half of the…
Q: The type of alloy used in manufacturing electric wire is important in reducing resistance. It has…
A:
Q: Mission Hotel has an average of 80 customers per hours arrive the front desk waiting check-in. They…
A:
Q: The table below represents a frequency distribution of marks for 110 students in mathematics in a…
A:
Q: Aswer the following to summarize the test of the hypothesis that the two variables level of…
A: There are two categorical variables which are level of psychology training and type of attributions…
Q: 4. 6. 10 The breaking strengths of cables produced by a certain manufacturer have a standard…
A:
Q: You have data on a sample of women of childbearing age in Botswana, which you want to use to study…
A: Formula for the test statistic of log likelihood ratio test: Test statistic=-2lθ0^-lθ^ From the…
Q: We want to conduct a hypothesis test of the claim that the population mean score on a nationwide…
A: Given X-bar=509 Mean=528
Q: The average cost per household of owning a brand new car is ₱5500. Suppose that we randomly selected…
A: Let X be the random variable from normal distribution with mean (μ) = 5500, standard deviation (σ) =…
Q: Ha: μ< 16 Ο Ho: μ< 16 Ο Ha: μ#16 Ο Ho: μ= 16.
A: Null and alternative hypothesis is denoted by H0 and Ha
Q: A city ballot includes a local initiative that would legalize gambling. The issue is hotly…
A:
Q: Consider a multinomial experiment with n = 250 and k = 4. The null hypothesis to be tested is H0: p1…
A: For the given data Perform Chi square goodness of fit
Q: appropriate than the z-curve in this case. ◼ 2.2. Based upon this study, find the 95% c
A: Given: The data is made on fracture toughness of base plate of 18% nickel maraging steel inksi in .
Q: What is the 99.5th percentile in a t-distribution with 9 degrees of freedom? a. 3.250 b. 3.169…
A: Solution-: We want to find 99.5th percentile in a t-distribution with 9 degrees of freedom?
Q: The rivers data set contains the length of 141 major rivers in North ica. Fit this distribution…
A: Given information: The rivers dataset is given in R – software.
Q: : The probability that a mountain-bike rider travelling along a certain track will have a tyre burst…
A:
Q: Al random sample of companies in electric utilities (1), financial services (II), and food…
A: The one way anova is used to test whether any significance difference between the means of more than…
Q: A study of 906 decision (to grant parole or not) made by a parole board produced the provided…
A:
Q: Exercise 1 Fortitude Insurance sells extended car warranties over the phone. They call people using…
A:
Q: Julia enjoys jogging. She has been jogging over a period of several years, during which time her…
A: Given,sample size(n)=90sample mean(x¯)=15.61population standard…
Q: Ex3\ X -- Xu id B (, ind satficient minimum sufficient
A:
Q: The latest US Census lists the average household size for all households in the US as 2.61 (i.e.…
A:
Q: 2. You conduct a linear regression in which the number of hours per week spent exercising is used to…
A: Regression predicts the future over the period of a time. It has two variable they are independent…
Q: As part of quality control, you carry out inspection of your product on a weekly basis. You set a…
A: Hello! As you have posted more than 3 sub parts, we are answering the first 3 sub-parts. In case…
Q: Repair revenues from labor costs of the bicycle shop are given below: X 7.1…
A: Solution-: Given data: X: 7.1,2.2,7.2,3.1,3.3,3.5,7.7,4.1,6.8,4.7,5.3,5.5,6.1 Y:…
Q: 1-1 21 3\ 4. 5. 8. 9. 10 A researcher wants to estimate the proportion of depressed individuals…
A:
Q: EX3\ Xi -- Xu iid B() ind sotE minimum sufficient
A: Given X~Bin(1,θ)

Step by step
Solved in 2 steps

- Given the partial results from a linear regression model below, a sample size of 504, and ɑ=0.05, What is the F-Statistic for the overall model? Is it statistically significant? What is the R2 for the regression model above?1) What is the probability of a stroke over the next 10 years for John Smith, a 68-year-old smoker who has blood pressure of 175? What action might the physician recommend for John to reduce the risk of stroke? 2) Is there any multicollinearity problem in the above multiple regression model? How do you know?The Mayor of texas whom is partners with a local agriculturalist wants to know how the amount of fertilizer and the amount of water given to plants affect their growth. The results were inputted into MINITAB so as to fit the model a) Write out the regression equation b) What is the sample size used in this investigation? c) Determine the values of *, ** and ***, **** d) Conduct a hypothesis test, at the 5% level of significance, to determine whether ? is significant. e) What would be the growth of the plant if 4g of fertilizer and 7g of ater was given to it daily? f) Carry out an F -test at the 1% significance level to determine whether the model is significant
- If there is no significant correlation between the response and explanatory variables, would the slope of the regression line be (a) positive (b) negative (c) zero?Multiple regression is sometimes used in litigation. In the case of Cargill, Inc. v. Hardin (1971), the prosecution charged that the cash price of wheat was manipulated in violation of the Commodity Exchange Act. In a statistical study conducted for this case, a multiple regression model was constructed to predict the cash price of wheat using three supply-and-demand explanatory variables: economic growth, population growth, and meat consumption. Data for 24 years were used to construct the regression equation, and a prediction for the suspect period was computed from this equation. Which of the independent variables is the most significant predictor of the cash price of wheat? a. Intercept b. Economic Growth c. Population Growth d. Meat ConsumptionMultiple regression is sometimes used in litigation. In the case of Cargill, Inc. v. Hardin (1971), the prosecution charged that the cash price of wheat was manipulated in violation of the Commodity Exchange Act. In a statistical study conducted for this case, a multiple regression model was constructed to predict the cash price of wheat using three supply-and-demand explanatory variables: economic growth, population growth, and meat consumption. Data for 24 years were used to construct the regression equation, and a prediction for the suspect period was computed from this equation Based on a significance level of 5%, which of the following independent variables significantly predict the cash price of wheat? a. Economic Growth b. Population Growth c. Meat Consumption d. All the independent variables significantly predict the cash price of wheat.
- Multiple regression is sometimes used in litigation. In the case of Cargill, Inc. v. Hardin (1971), the prosecution charged that the cash price of wheat was manipulated in violation of the Commodity Exchange Act. In a statistical study conducted for this case, a multiple regression model was constructed to predict the cash price of wheat using three supply-and-demand explanatory variables: economic growth, population growth, and meat consumption. Data for 24 years were used to construct the regression equation, and a prediction for the suspect period was computed from this equation. The actual cash price of wheat under investigation in 1963 was $2.13. Based on the comparison of the correct predicted cash price calculated in the previous question and the actual cash price, what does the evidence suggest about Cargill, Inc.? a. Because the predicted price is relatively close to the actual price (within one cent), Cargill, Inc. probably did not artificially manipulate the price of wheat.…Multiple regression is sometimes used in litigation. In the case of Cargill, Inc. v. Hardin (1971), the prosecution charged that the cash price of wheat was manipulated in violation of the Commodity Exchange Act. In a statistical study conducted for this case, a multiple regression model was constructed to predict the cash price of wheat using three supply-and-demand explanatory variables: economic growth, population growth, and meat consumption. Data for 24 years were used to construct the regression equation, and a prediction for the suspect period was computed from this equation. In 1963, during the period in question, economic growth was 3.8; population growth was 1.40; and meat consumption was 152.95. Based on these values, what would be the predicted cash price of wheat at this time in 1963?Multiple regression is sometimes used in litigation. In the case of Cargill, Inc. v. Hardin (1971), the prosecution charged that the cash price of wheat was manipulated in violation of the Commodity Exchange Act. In a statistical study conducted for this case, a multiple regression model was constructed to predict the cash price of wheat using three supply-and-demand explanatory variables: economic growth, population growth, and meat consumption. Data for 24 years were used to construct the regression equation, and a prediction for the suspect period was computed from this equation. The following output represents the regression analysis. . Before the judge and jury consider the results of the regression model, they must ensure that the model is valid. What is the proper hypothesis test for this model, and what is the proper conclusion?
- Sarah is the office manager for a group of financial advisors who provide financial services for individual clients. She would like to investigate whether a relationship exists between the number of presentations made to prospective clients in a month and the number of new clients per month. The following table shows the number of presentations and corresponding new clients for a random sample of six employees. Employee Presentations New Clients 1 7 2 2 9 3 3 9 4 4 10 3 5 11 5 6 12 3 Sarah would like to use simple regression analysis to estimate the number of new clients per month based on the number of presentations made by the employee per month. The expected number of new clients per month for an employee who made 10 presentations per month is ________. 2.3982 1.6753 3.0521 3.4348Bill is the office manager for a group of financial advisors who provide financial services for individual clients. She would like to investigate whether a relationship exists between the number of presentations made to prospective clients in a month and the number of new clients per month. The following table shows the number of presentations and corresponding new clients for a random sample of six employees. Employee Presentations New Clients 1 2 1 2 8 2 3 9 4 4 10 3 5 11 5 6 12 6 Bill would like to use simple regression analysis to estimate the number of new clients per month based on the number of presentations made by the employee per month. The average number of new clients per month for an employee who made 20 presentations per month is ________. 5.02 5.45 3.43 8.69If a sample of 25 pairs of data yields a correlation coefficient, r, of 0.390 and the scatterplot displays a linear trend, can you use the regression equation to make predictions, assuming your x-values are within the domain of the data set? Choose your answer from the multiple choice answers below A.) Yes, because rcrit = 0.396 and the regression coefficient, r, is less than this value. B.) Yes, because rcrit = 0.381 and the regression coefficient, r, is greater than this value. C.) No, because rcrit = 0.381 and the regression coefficient, r, is greater than this value. D.) No, because rcrit = 0.396 and the regression coefficient, r, is less than this value.