8. A. Use Excel (or another graphing program) to draw the growth curve, In (X/X.) vs time, for bacteria grown in a 20 L suspension cell culture, given the following data: - initial concentration: 0.120 gdw cells/L Also report: - lag time: 1.5 hours - mass doubling time during exponential growth: 250 minutes - duration of exponential growth phase: 1 day (24 hours) - negligible time in the deceleration phase - 13 hours in the endogenous metabolism phase with no change in cell concentration - cell death rate with k = 0.0178 min -¹. B. What is the specific growth rate, μ? C. What is the maximum concentration of cells in the reactor? (gdw cells/L) and when does this occur? D. Other than time zero or the end of lag phase, at what time is the concentration of living cells in the reactor equal to the initial concentration of 0.120 gdw/L?
8. A. Use Excel (or another graphing program) to draw the growth curve, In (X/X.) vs time, for bacteria grown in a 20 L suspension cell culture, given the following data: - initial concentration: 0.120 gdw cells/L Also report: - lag time: 1.5 hours - mass doubling time during exponential growth: 250 minutes - duration of exponential growth phase: 1 day (24 hours) - negligible time in the deceleration phase - 13 hours in the endogenous metabolism phase with no change in cell concentration - cell death rate with k = 0.0178 min -¹. B. What is the specific growth rate, μ? C. What is the maximum concentration of cells in the reactor? (gdw cells/L) and when does this occur? D. Other than time zero or the end of lag phase, at what time is the concentration of living cells in the reactor equal to the initial concentration of 0.120 gdw/L?

Chapter2: Aquatic Plants And Animals
Section: Chapter Questions
Problem 2KA

Related questions
Question
Transcribed Image Text:8.
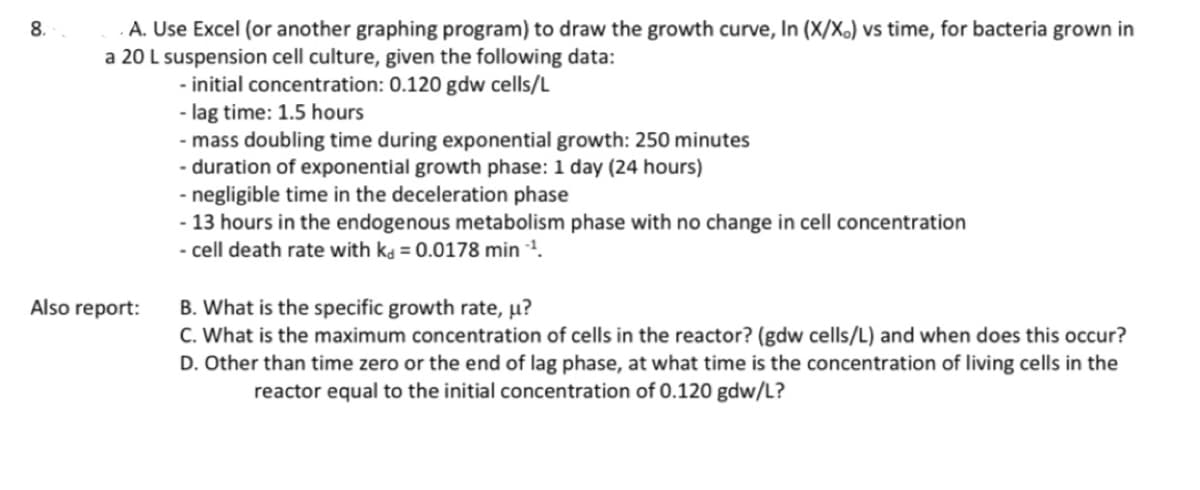
A. Use Excel (or another graphing program) to draw the growth curve, In (X/X.) vs time, for bacteria grown in
a 20 L suspension cell culture, given the following data:
- initial concentration: 0.120 gdw cells/L
Also report:
- lag time: 1.5 hours
- mass doubling time during exponential growth: 250 minutes
- duration of exponential growth phase: 1 day (24 hours)
- negligible time in the deceleration phase
- 13 hours in the endogenous metabolism phase with no change in cell concentration
- cell death rate with k = 0.0178 min -¹.
B. What is the specific growth rate, µ?
C. What is the maximum concentration of cells in the reactor? (gdw cells/L) and when does this occur?
D. Other than time zero or the end of lag phase, at what time is the concentration of living cells in the
reactor equal to the initial concentration of 0.120 gdw/L?
Expert Solution
This question has been solved!
Explore an expertly crafted, step-by-step solution for a thorough understanding of key concepts.

This is a popular solution!

Trending now
This is a popular solution!

Step by step
Solved in 4 steps with 9 images

Recommended textbooks for you