8. Forty volunteer drivers are separated into two groups of 20 drivers each at random. The first group is asked to pay particular attention to braking smoothly when approaching a red light or stop sign. The second group is given no special instructions. All drivers report the gallons of gasoline used at the end of a month. • The mean for the first group is 43.16 gallons of gas. • The mean for the second group is 54.63 gallons of gas. • The difference in means for the two groups is -11.47 gallons of gas. The data for both groups are combined and redistributed at random into two groups of 20. The means for each redistributed group are calculated, and the difference in means is recorded. The differences are represented in the histogram. 20 T 18 16 14 12 10 -12-11-10-9 -8 -7 -6 -5 -4 -3 -2 -1 0 1 2 3 4 5 6 7 8 9 10 11 12 13 difference in mean gas usage (gallons) Which of these conclusions and justifications is the most reasonable?
8. Forty volunteer drivers are separated into two groups of 20 drivers each at random. The first group is asked to pay particular attention to braking smoothly when approaching a red light or stop sign. The second group is given no special instructions. All drivers report the gallons of gasoline used at the end of a month. • The mean for the first group is 43.16 gallons of gas. • The mean for the second group is 54.63 gallons of gas. • The difference in means for the two groups is -11.47 gallons of gas. The data for both groups are combined and redistributed at random into two groups of 20. The means for each redistributed group are calculated, and the difference in means is recorded. The differences are represented in the histogram. 20 T 18 16 14 12 10 -12-11-10-9 -8 -7 -6 -5 -4 -3 -2 -1 0 1 2 3 4 5 6 7 8 9 10 11 12 13 difference in mean gas usage (gallons) Which of these conclusions and justifications is the most reasonable?

Glencoe Algebra 1, Student Edition, 9780079039897, 0079039898, 2018
18th Edition
ISBN:9780079039897
Author:Carter
Publisher:Carter
Chapter10: Statistics
Section10.6: Summarizing Categorical Data
Problem 10CYU

Related questions

Question
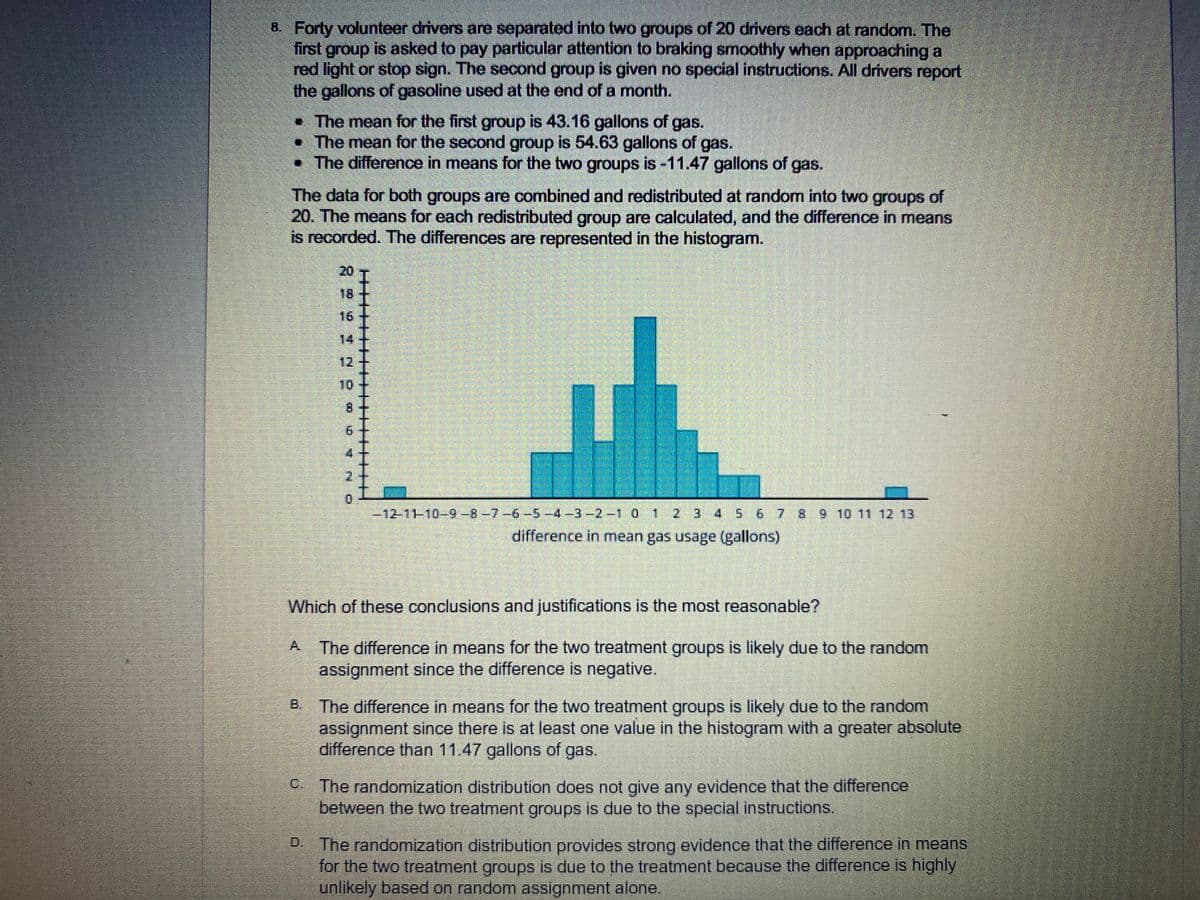
Transcribed Image Text:B. Forty volunteer drivers are separated into two groups of 20 drivers each at random. The
first group is asked to pay particular attention to braking smoothly when approaching a
red light or stop sign. The second group is given no special instructions. All drivers report
the gallons of gasoline used at the end of a month.
• The mean for the first group is 43.16 gallons of gas.
• The mean for the second group is 54.63 gallons of gas.
• The difference in means for the two groups is -11.47 gallons of gas.
The data for both groups are combined and redistributed at random into two groups of
20. The means for each redistributed group are calculated, and the difference in means
is recorded. The differences are represented in the histogram.
20
18
16
14
12
10
9.
-12-11-10-9-8-7-6-5-4-3-2-1 0 1 2 3 4 5 6 7 8 9 10 11 12 13
difference in mean gas usage (gallons)
Which of these conclusions and justifications is the most reasonable?
A The difference in means for the two treatment groups is likely due to the random
assignment since the difference is negative.
B. The difference in means for the two treatment groups is likely due to the random
assignment since there is at least one value in the histogram with a greater absolute
difference than 11.47 gallons of gas.
C.
-The randomization distribution does not give any evidence that the difference
between the two treatment groups is due to the special instructions.
D The randomization distribution provides strong evidence that the difference in means
for the two treatment groups is due to the treatment because the difference is highly
unlikely based on random assignment alone.
Expert Solution
This question has been solved!
Explore an expertly crafted, step-by-step solution for a thorough understanding of key concepts.

This is a popular solution!

Trending now
This is a popular solution!

Step by step
Solved in 2 steps

Knowledge Booster


Learn more about
Need a deep-dive on the concept behind this application? Look no further. Learn more about this topic, statistics and related others by exploring similar questions and additional content below.Recommended textbooks for you
Glencoe Algebra 1, Student Edition, 9780079039897…
Algebra
ISBN:
9780079039897
Author:
Carter
Publisher:
McGraw Hill

Holt Mcdougal Larson Pre-algebra: Student Edition…
Algebra
ISBN:
9780547587776
Author:
HOLT MCDOUGAL
Publisher:
HOLT MCDOUGAL

College Algebra (MindTap Course List)
Algebra
ISBN:
9781305652231
Author:
R. David Gustafson, Jeff Hughes
Publisher:
Cengage Learning
Glencoe Algebra 1, Student Edition, 9780079039897…
Algebra
ISBN:
9780079039897
Author:
Carter
Publisher:
McGraw Hill
Holt Mcdougal Larson Pre-algebra: Student Edition…
Algebra
ISBN:
9780547587776
Author:
HOLT MCDOUGAL
Publisher:
HOLT MCDOUGAL
College Algebra (MindTap Course List)
Algebra
ISBN:
9781305652231
Author:
R. David Gustafson, Jeff Hughes
Publisher:
Cengage Learning
