8. Listed below are the statistical distributions that rely on the number of degrees of freedom of the dataset, EXCEPT: O A. Standard Normal (z) distribution O B. Chi-Square distribution O C. F distribution O D. t Distribution
8. Listed below are the statistical distributions that rely on the number of degrees of freedom of the dataset, EXCEPT: O A. Standard Normal (z) distribution O B. Chi-Square distribution O C. F distribution O D. t Distribution

Glencoe Algebra 1, Student Edition, 9780079039897, 0079039898, 2018
18th Edition
ISBN:9780079039897
Author:Carter
Publisher:Carter
Chapter10: Statistics
Section10.4: Distributions Of Data
Problem 19PFA

Related questions
Question
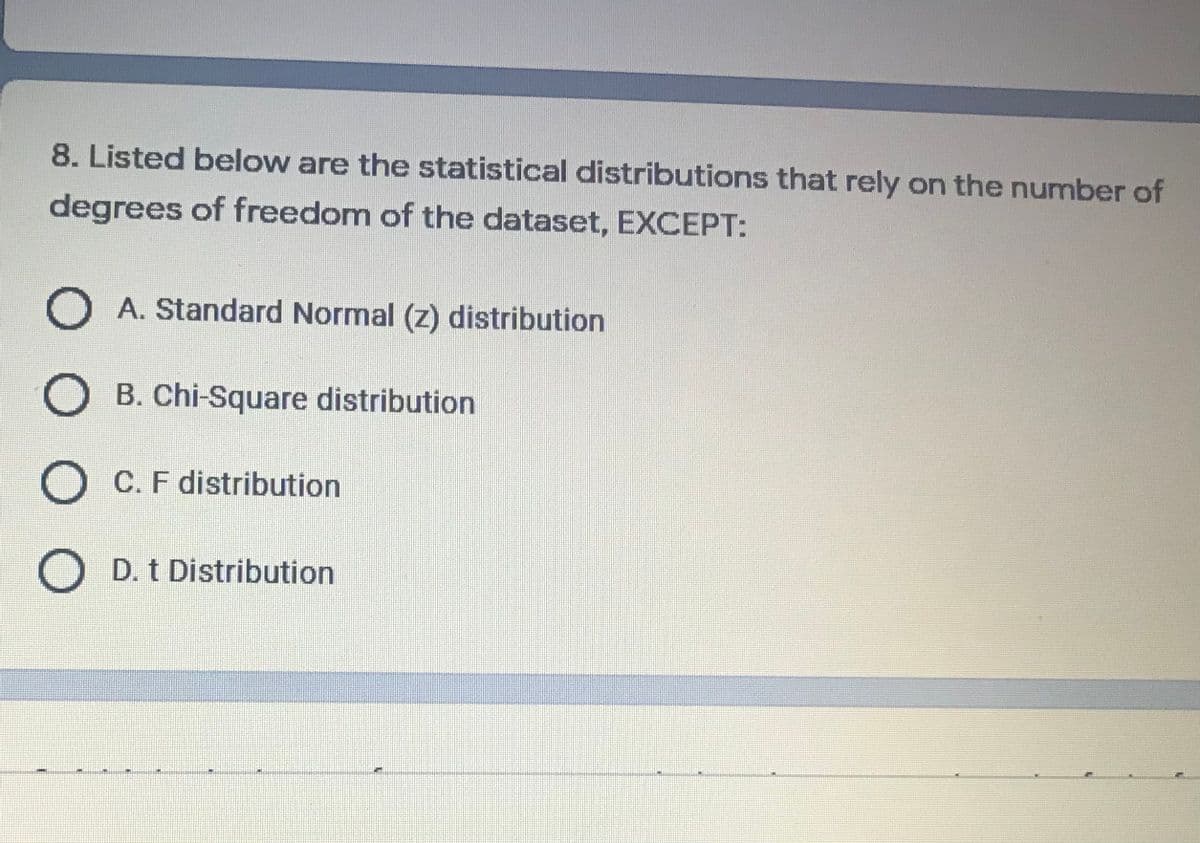
Transcribed Image Text:8. Listed below are the statistical distributions that rely on the number of
degrees of freedom of the dataset, EXCEPT:
O A. Standard Normal (z) distribution
O B. Chi-Square distribution
O C. F distribution
D. t Distribution
Expert Solution
This question has been solved!
Explore an expertly crafted, step-by-step solution for a thorough understanding of key concepts.

Step by step
Solved in 3 steps

Recommended textbooks for you
Glencoe Algebra 1, Student Edition, 9780079039897…
Algebra
ISBN:
9780079039897
Author:
Carter
Publisher:
McGraw Hill
Glencoe Algebra 1, Student Edition, 9780079039897…
Algebra
ISBN:
9780079039897
Author:
Carter
Publisher:
McGraw Hill