a) Thirty observations on the oxide thickness of individual silicon wafers are shown in Table 6E.23. Use these data to set up a control chart on oxide thickness and a moving range chart. Does the process exhibit statistical control? Does oxide thickness follow a normal distribution? b) Following the establishment of the control charte
a) Thirty observations on the oxide thickness of individual silicon wafers are shown in Table 6E.23. Use these data to set up a control chart on oxide thickness and a moving range chart. Does the process exhibit statistical control? Does oxide thickness follow a normal distribution? b) Following the establishment of the control charte

MATLAB: An Introduction with Applications
6th Edition
ISBN:9781119256830
Author:Amos Gilat
Publisher:Amos Gilat
Chapter1: Starting With Matlab
Section: Chapter Questions
Problem 1P

Related questions
Question
Very important Note:
Please to perform in excel and show formulas. (Show pictures)
perform in excel and show formulas
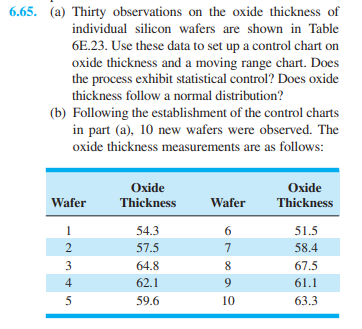
Transcribed Image Text:6.65. (a) Thirty observations on the oxide thickness of
individual silicon wafers are shown in Table
6E.23. Use these data to set up a control chart on
oxide thickness and a moving range chart. Does
the process exhibit statistical control? Does oxide
thickness follow a normal distribution?
(b) Following the establishment of the control charts
in part (a), 10 new wafers were observed. The
oxide thickness measurements are as follows:
Oxide
Oxide
Wafer
Thickness
Wafer
Thickness
1
54.3
6.
51.5
2
57.5
7
58.4
3
64.8
8
67.5
4
62.1
61.1
5
59.6
10
63.3
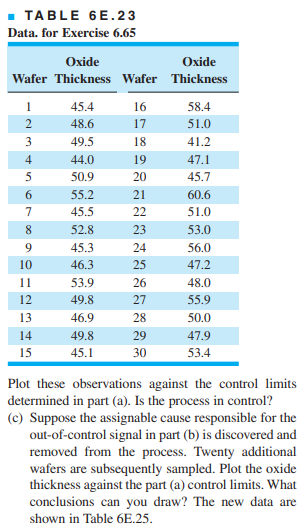
Transcribed Image Text:- TABLE 6E.23
Data. for Exercise 6.65
Oxide
Oxide
Wafer Thickness Wafer Thickness
45.4
16
58.4
2
48.6
17
51.0
3
49.5
18
41.2
4
44.0
19
47.1
5
50.9
20
45.7
55.2
21
60.6
45.5
22
51.0
52.8
23
53.0
45.3
24
56.0
10
46.3
25
47.2
11
53.9
26
48.0
12
49.8
27
55.9
13
46.9
28
50.0
14
49.8
29
47.9
15
45.1
30
53.4
Plot these observations against the control limits
determined in part (a). Is the process in control?
(c) Suppose the assignable cause responsible for the
out-of-control signal in part (b) is discovered and
removed from the process. Twenty additional
wafers are subsequently sampled. Plot the oxide
thickness against the part (a) control limits. What
conclusions can you draw? The new data are
shown in Table 6E.25.
6700
Expert Solution
This question has been solved!
Explore an expertly crafted, step-by-step solution for a thorough understanding of key concepts.

This is a popular solution!

Trending now
This is a popular solution!

Step by step
Solved in 3 steps with 3 images

Recommended textbooks for you
MATLAB: An Introduction with Applications
Statistics
ISBN:
9781119256830
Author:
Amos Gilat
Publisher:
John Wiley & Sons Inc

Probability and Statistics for Engineering and th…
Statistics
ISBN:
9781305251809
Author:
Jay L. Devore
Publisher:
Cengage Learning

Statistics for The Behavioral Sciences (MindTap C…
Statistics
ISBN:
9781305504912
Author:
Frederick J Gravetter, Larry B. Wallnau
Publisher:
Cengage Learning
MATLAB: An Introduction with Applications
Statistics
ISBN:
9781119256830
Author:
Amos Gilat
Publisher:
John Wiley & Sons Inc
Probability and Statistics for Engineering and th…
Statistics
ISBN:
9781305251809
Author:
Jay L. Devore
Publisher:
Cengage Learning
Statistics for The Behavioral Sciences (MindTap C…
Statistics
ISBN:
9781305504912
Author:
Frederick J Gravetter, Larry B. Wallnau
Publisher:
Cengage Learning

Elementary Statistics: Picturing the World (7th E…
Statistics
ISBN:
9780134683416
Author:
Ron Larson, Betsy Farber
Publisher:
PEARSON

The Basic Practice of Statistics
Statistics
ISBN:
9781319042578
Author:
David S. Moore, William I. Notz, Michael A. Fligner
Publisher:
W. H. Freeman

Introduction to the Practice of Statistics
Statistics
ISBN:
9781319013387
Author:
David S. Moore, George P. McCabe, Bruce A. Craig
Publisher:
W. H. Freeman