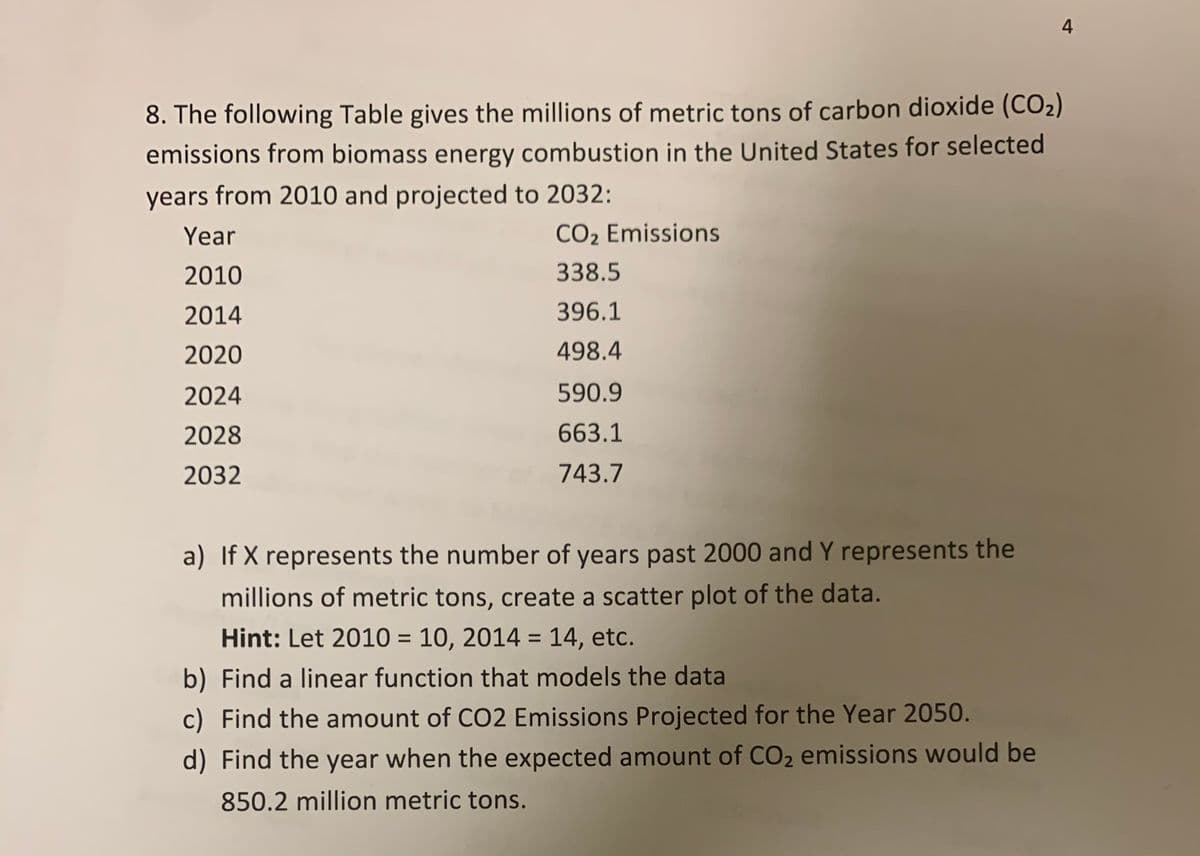
8. The following Table gives the millions of metric tons of carbon dioxide (CO2) emissions from biomass energy combustion in the United States for selected years from 2010 and projected to 2032: Year CO2 Emissions 2010 338.5 2014 396.1 2020 498.4 2024 590.9 2028 663.1 2032 743.7 a) If X represents the number of years past 2000 and Y represents the millions of metric tons, create a scatter plot of the data. Hint: Let 2010 = 10, 2014 = 14, etc. %3D b) Find a linear function that models the data c) Find the amount of CO2 Emissions Projected for the Year 2050. d) Find the year when the expected amount of CO2 emissions would be 850.2 million metric tons.
8. The following Table gives the millions of metric tons of carbon dioxide (CO2) emissions from biomass energy combustion in the United States for selected years from 2010 and projected to 2032: Year CO2 Emissions 2010 338.5 2014 396.1 2020 498.4 2024 590.9 2028 663.1 2032 743.7 a) If X represents the number of years past 2000 and Y represents the millions of metric tons, create a scatter plot of the data. Hint: Let 2010 = 10, 2014 = 14, etc. %3D b) Find a linear function that models the data c) Find the amount of CO2 Emissions Projected for the Year 2050. d) Find the year when the expected amount of CO2 emissions would be 850.2 million metric tons.

Trigonometry (MindTap Course List)
10th Edition
ISBN:9781337278461
Author:Ron Larson
Publisher:Ron Larson
Chapter6: Topics In Analytic Geometry
Section6.4: Hyperbolas
Problem 5ECP: Repeat Example 5 when microphone A receives the sound 4 seconds before microphone B.

Related questions

Question
Transcribed Image Text:4
8. The following Table gives the millions of metric tons of carbon dioxide (CO2)
emissions from biomass energy combustion in the United States for selected
years from 2010 and projected to 2032:
Year
CO2 Emissions
2010
338.5
2014
396.1
2020
498.4
2024
590.9
2028
663.1
2032
743.7
a) If X represents the number of years past 2000 and Y represents the
millions of metric tons, create a scatter plot of the data.
Hint: Let 2010 = 10, 2014 = 14, etc.
%3D
b) Find a linear function that models the data
c) Find the amount of CO2 Emissions Projected for the Year 2050.
d) Find the year when the expected amount of CO2 emissions would be
850.2 million metric tons.
Expert Solution
This question has been solved!
Explore an expertly crafted, step-by-step solution for a thorough understanding of key concepts.

This is a popular solution!

Trending now
This is a popular solution!

Step by step
Solved in 4 steps with 3 images

Knowledge Booster


Learn more about
Need a deep-dive on the concept behind this application? Look no further. Learn more about this topic, statistics and related others by exploring similar questions and additional content below.Recommended textbooks for you
Trigonometry (MindTap Course List)
Trigonometry
ISBN:
9781337278461
Author:
Ron Larson
Publisher:
Cengage Learning
Trigonometry (MindTap Course List)
Trigonometry
ISBN:
9781337278461
Author:
Ron Larson
Publisher:
Cengage Learning