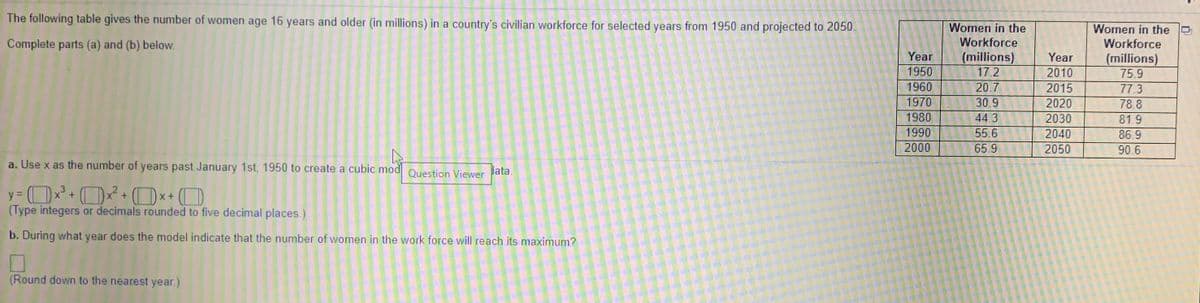
The following table gives the number of women age 16 years and older (in millions) in a country's civilian workforce for selected years from 1950 and projected to 2050 Women in the Workforce (millions) 17 2 20.7 30 9 44.3 55.6 65 9 Women in the Complete parts (a) and (b) below. Workforce Year 1950 1960 Year (millions) 75.9 1970 1980 1990 2000 2010 2015 2020 2030 2040 2050 77.3 78 8 819 86.9 90 6 a. Use x as the number of years past January 1st, 1950 to create a cubic mod Question Viewer Jata. (Type integers or decimals rounded to five decimal places.) b. During what year does the model indicate that the number of women in the work force will reach its maximum? (Round down to the nearest year)


Continuous Probability Distributions
Probability distributions are of two types, which are continuous probability distributions and discrete probability distributions. A continuous probability distribution contains an infinite number of values. For example, if time is infinite: you could count from 0 to a trillion seconds, billion seconds, so on indefinitely. A discrete probability distribution consists of only a countable set of possible values.
Normal Distribution
Suppose we had to design a bathroom weighing scale, how would we decide what should be the range of the weighing machine? Would we take the highest recorded human weight in history and use that as the upper limit for our weighing scale? This may not be a great idea as the sensitivity of the scale would get reduced if the range is too large. At the same time, if we keep the upper limit too low, it may not be usable for a large percentage of the population!


Trending now
This is a popular solution!

Step by step
Solved in 2 steps with 2 images


