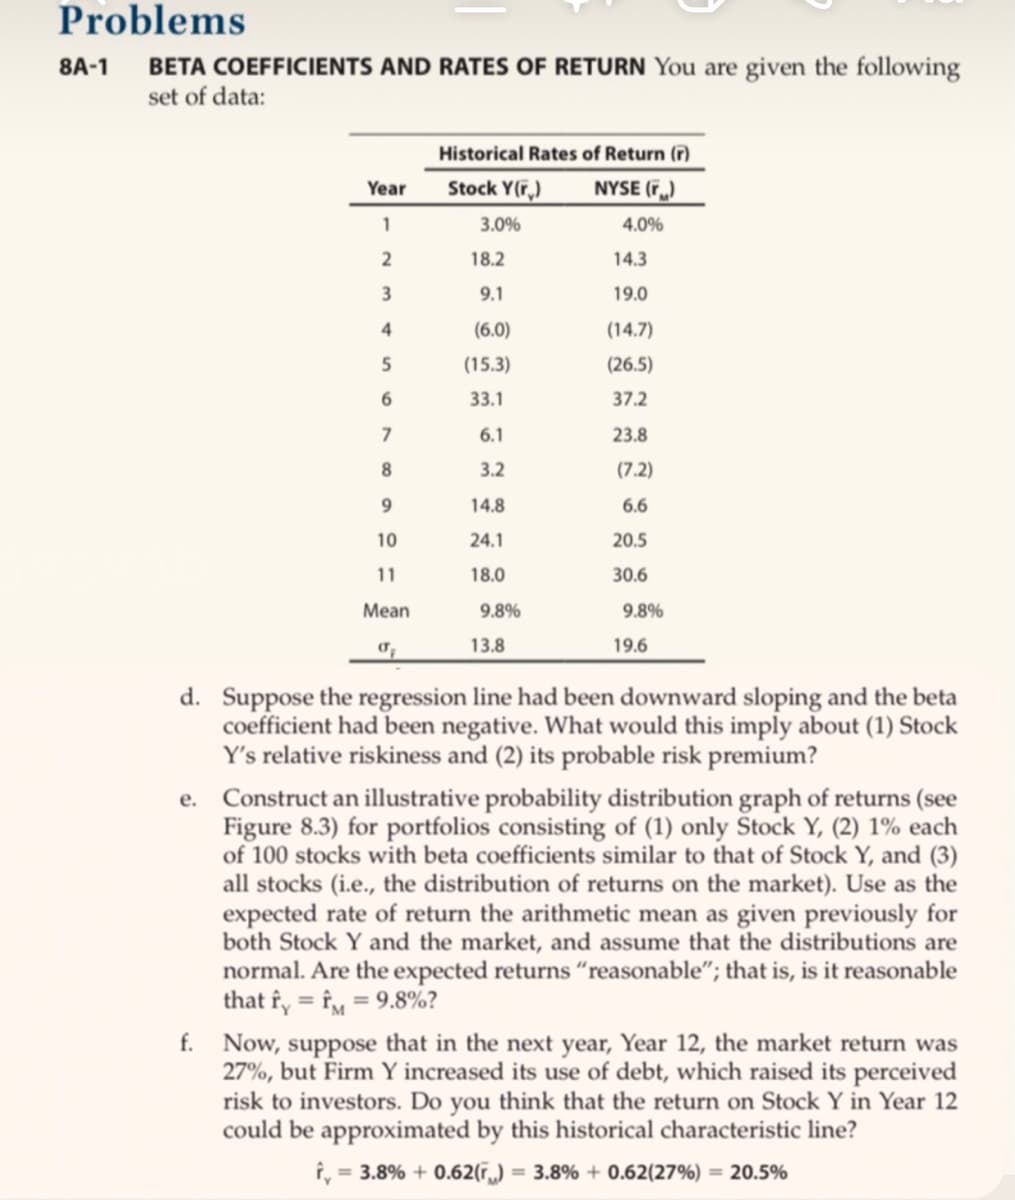
8A-1 BETA COEFFICIENTS AND RATES OF RETURN You are given the following set of data: Historical Rates of Return () Stock Y(F,) NYSE (F.) Year 1 3.0% 4.0% 18.2 14.3 3 9.1 19.0 4 (6.0) (14.7) 5 (15.3) (26.5) 33.1 37.2 6.1 23.8 8. 3.2 (7.2) 9. 14.8 6.6 10 24.1 20.5 11 18.0 30.6 Mean 9.8% 9.8% 13.8 19.6 d. Suppose the regression line had been downward sloping and the beta coefficient had been negative. What would this imply about (1) Stock Y's relative riskiness and (2) its probable risk premium? e. Construct an illustrative probability distribution graph of returns (see Figure 8.3) for portfolios consisting of (1) only Stock Y, (2) 1% each of 100 stocks with beta coefficients similar to that of Stock Y, and (3) all stocks (i.e., the distribution of returns on the market). Use as the expected rate of return the arithmetic mean as given previously for both Stock Y and the market, and assume that the distributions are normal. Are the expected returns "reasonable"; that is, is it reasonable that fy = fM = 9.8%? %3D %3D f. Now, suppose that in the next year, Year 12, the market return was 27%, but Firm Y increased its use of debt, which raised its perceived risk to investors. Do you think that the return on Stock Y in Year 12 could be approximated by this historical characteristic line?


Dividend Valuation
Dividend refers to a reward or cash that a company gives to its shareholders out of the profits. Dividends can be issued in various forms such as cash payment, stocks, or in any other form as per the company norms. It is usually a part of the profit that the company shares with its shareholders.
Dividend Discount Model
Dividend payments are generally paid to investors or shareholders of a company when the company earns profit for the year, thus representing growth. The dividend discount model is an important method used to forecast the price of a company’s stock. It is based on the computation methodology that the present value of all its future dividends is equivalent to the value of the company.
Capital Gains Yield
It may be referred to as the earnings generated on an investment over a particular period of time. It is generally expressed as a percentage and includes some dividends or interest earned by holding a particular security. Cases, where it is higher normally, indicate the higher income and lower risk. It is mostly computed on an annual basis and is different from the total return on investment. In case it becomes too high, indicates that either the stock prices are going down or the company is paying higher dividends.
Stock Valuation
In simple words, stock valuation is a tool to calculate the current price, or value, of a company. It is used to not only calculate the value of the company but help an investor decide if they want to buy, sell or hold a company's stocks.

Step by step
Solved in 2 steps


