9-10. Which of the following best describes the given shaded region under the normal curve? c. to the left of z=1 a. To the right of z = 1 Above z=-1 b. d. between z= -1 and z = 1 11. Find the area of the shaded region of the given figure a. 0.1587 c. 0.3413. b. 0.3907 d. 0. 8413 12. Find the area under the standard normal curve between z = 0 and z = 3. a. 0.4987 b. 0.5000 c. 0.9987 d1.4987
9-10. Which of the following best describes the given shaded region under the normal curve? c. to the left of z=1 a. To the right of z = 1 Above z=-1 b. d. between z= -1 and z = 1 11. Find the area of the shaded region of the given figure a. 0.1587 c. 0.3413. b. 0.3907 d. 0. 8413 12. Find the area under the standard normal curve between z = 0 and z = 3. a. 0.4987 b. 0.5000 c. 0.9987 d1.4987

MATLAB: An Introduction with Applications
6th Edition
ISBN:9781119256830
Author:Amos Gilat
Publisher:Amos Gilat
Chapter1: Starting With Matlab
Section: Chapter Questions
Problem 1P

Related questions
Question
100%
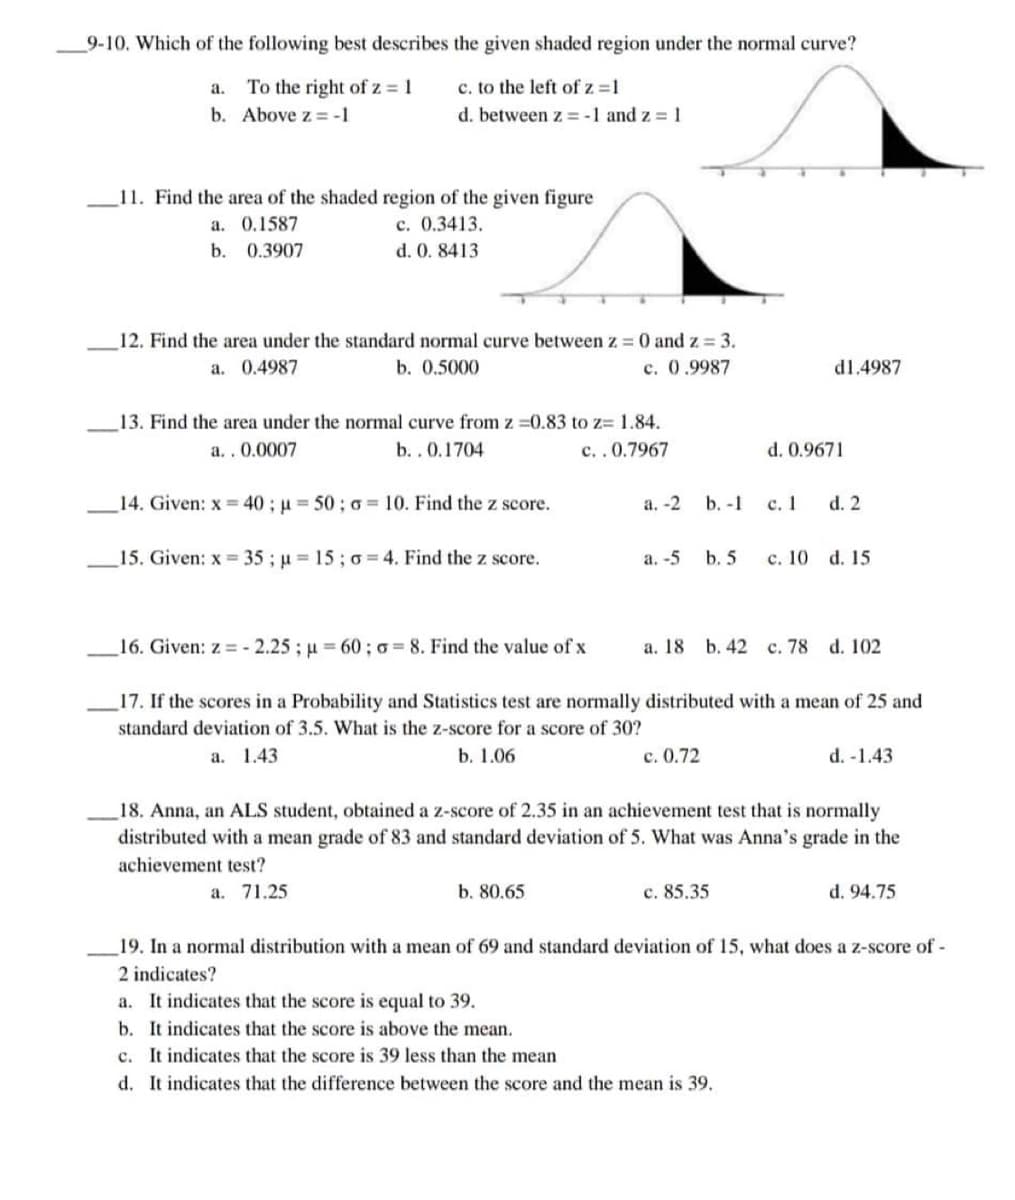
Transcribed Image Text:9-10. Which of the following best describes the given shaded region under the normal curve?
c. to the left of z=1
a. To the right of z = 1
b. Above z=-1
d. between z = -1 and z = 1
11. Find the area of the shaded region of the given figure
a.
0.1587
c. 0.3413.
b. 0.3907
d. 0. 8413
12. Find the area under the standard normal curve between z = 0 and z= 3.
a. 0.4987
b. 0.5000
c. 0.9987
d1.4987
13. Find the area under the normal curve from z=0.83 to z= 1.84.
a..0.0007
b..0.1704
c..0.7967
d. 0.9671
14. Given: x=40; μ = 50; o 10. Find the z score.
a. -2
b. -1
c. 1
d. 2
15. Given: x= 35; p = 15; o 4. Find the z score.
a. -5
b. 5
c. 10 d. 15
16. Given: z-2.25; μ=60; a= 8. Find the value of x
a. 18 b. 42 c. 78 d. 102
17. If the scores in a Probability and Statistics test are normally distributed with a mean of 25 and
standard deviation of 3.5. What is the z-score for a score of 30?
a. 1.43
b. 1.06
c. 0.72
d. -1.43
18. Anna, an ALS student, obtained a z-score of 2.35 in an achievement test that is normally
distributed with a mean grade of 83 and standard deviation of 5. What was Anna's grade in the
achievement test?
a. 71.25
b. 80.65
c. 85.35
d. 94.75
19. In a normal distribution with a mean of 69 and standard deviation of 15, what does a z-score of -
2 indicates?
a. It indicates that the score is equal to 39.
b. It indicates that the score is above the mean.
c. It indicates that the score is 39 less than the mean
d. It indicates that the difference between the score and the mean is 39.
Expert Solution
This question has been solved!
Explore an expertly crafted, step-by-step solution for a thorough understanding of key concepts.

Step by step
Solved in 4 steps

Recommended textbooks for you
MATLAB: An Introduction with Applications
Statistics
ISBN:
9781119256830
Author:
Amos Gilat
Publisher:
John Wiley & Sons Inc

Probability and Statistics for Engineering and th…
Statistics
ISBN:
9781305251809
Author:
Jay L. Devore
Publisher:
Cengage Learning

Statistics for The Behavioral Sciences (MindTap C…
Statistics
ISBN:
9781305504912
Author:
Frederick J Gravetter, Larry B. Wallnau
Publisher:
Cengage Learning
MATLAB: An Introduction with Applications
Statistics
ISBN:
9781119256830
Author:
Amos Gilat
Publisher:
John Wiley & Sons Inc
Probability and Statistics for Engineering and th…
Statistics
ISBN:
9781305251809
Author:
Jay L. Devore
Publisher:
Cengage Learning
Statistics for The Behavioral Sciences (MindTap C…
Statistics
ISBN:
9781305504912
Author:
Frederick J Gravetter, Larry B. Wallnau
Publisher:
Cengage Learning

Elementary Statistics: Picturing the World (7th E…
Statistics
ISBN:
9780134683416
Author:
Ron Larson, Betsy Farber
Publisher:
PEARSON

The Basic Practice of Statistics
Statistics
ISBN:
9781319042578
Author:
David S. Moore, William I. Notz, Michael A. Fligner
Publisher:
W. H. Freeman

Introduction to the Practice of Statistics
Statistics
ISBN:
9781319013387
Author:
David S. Moore, George P. McCabe, Bruce A. Craig
Publisher:
W. H. Freeman