9) The following results are from a regression where the dependent variable is GRADUATION RATE and the independent variables are % OF CLASSES UNDER 20, % OF CLASSES OF 50 OR MORE, STUDENT/FACULTY RATIO, ACCEPTANCE RATE, 1ST YEAR STUDENTS IN TOP 10% OF HS CLASS. The data were split into 2 samples and the following regression results were obtained from the split data. a) What is heteroscedasticity? (b) Why is heteroscedasticity a problem? c) Based on a comparison of the two sets of output, does it appear that there is heteroscedasticity in the data set? Explain. Be sure to write down your null and alternative hypothesis, calculate the test statistic, and find your critical value (test at the 5% level of significance).
9) The following results are from a regression where the dependent variable is GRADUATION RATE and the independent variables are % OF CLASSES UNDER 20, % OF CLASSES OF 50 OR MORE, STUDENT/FACULTY RATIO, ACCEPTANCE RATE, 1ST YEAR STUDENTS IN TOP 10% OF HS CLASS. The data were split into 2 samples and the following regression results were obtained from the split data. a) What is heteroscedasticity? (b) Why is heteroscedasticity a problem? c) Based on a comparison of the two sets of output, does it appear that there is heteroscedasticity in the data set? Explain. Be sure to write down your null and alternative hypothesis, calculate the test statistic, and find your critical value (test at the 5% level of significance).

Glencoe Algebra 1, Student Edition, 9780079039897, 0079039898, 2018
18th Edition
ISBN:9780079039897
Author:Carter
Publisher:Carter
Chapter10: Statistics
Section10.3: Measures Of Spread
Problem 1GP

Related questions
Question
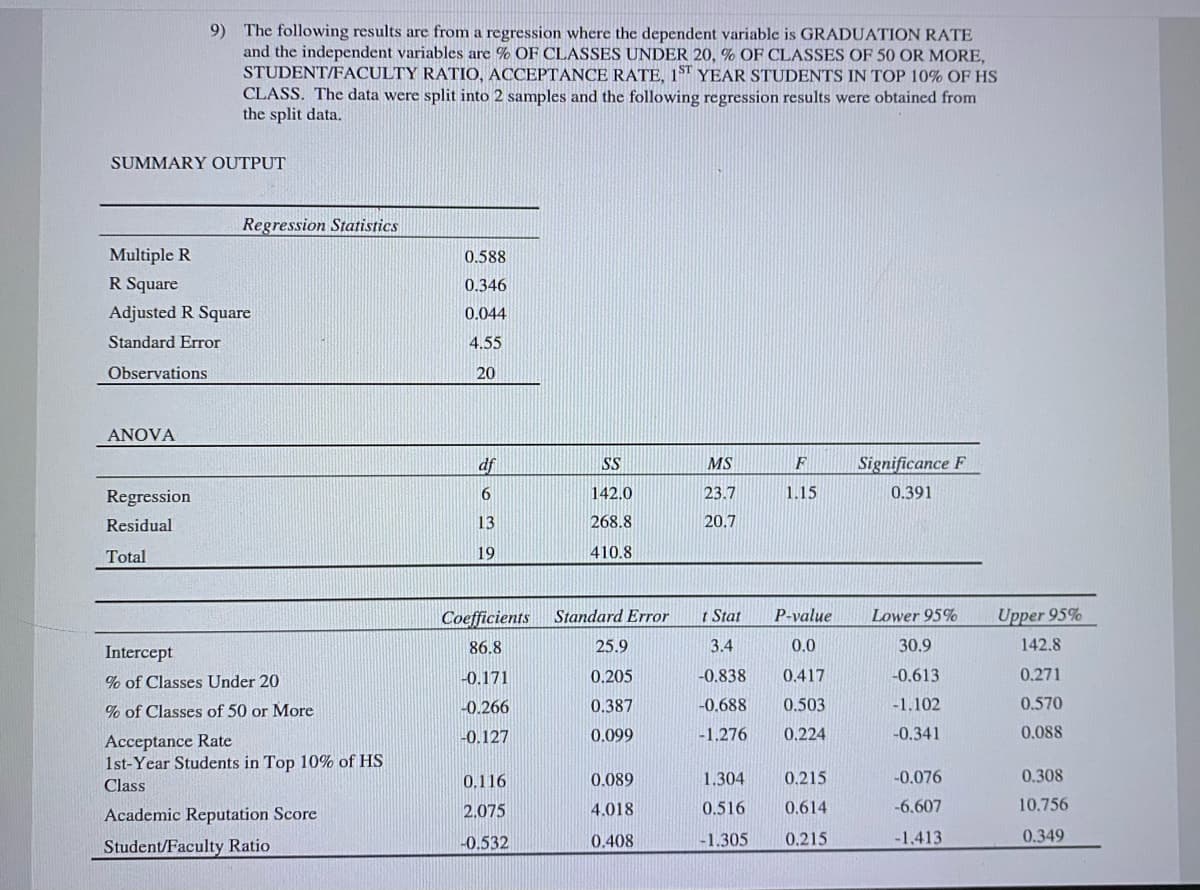
9) The following results are from a regression where the dependent variable is GRADUATION RATE and the independent variables are % OF CLASSES UNDER 20, % OF CLASSES OF 50 OR MORE, STUDENT/FACULTY RATIO, ACCEPTANCE RATE, 1ST YEAR STUDENTS IN TOP 10% OF HS CLASS. The data were split into 2 samples and the following regression results were obtained from the split data.
a) What is heteroscedasticity?
(b) Why is heteroscedasticity a problem?
c) Based on a comparison of the two sets of output, does it appear that there is heteroscedasticity in the data set? Explain. Be sure to write down your null and alternative hypothesis, calculate the test statistic, and find your critical value (test at the 5% level of significance).
Transcribed Image Text:9) The following results are from a regression where the dependent variable is GRADUATION RATE
and the independent variables are % OF CLASSES UNDER 20, % OF CLASSES OF 50 OR MORE,
STUDENT/FACULTY RATIO, ACCEPTANCE RATE, 1ST YEAR STUDENTS IN TOP 10% OF HS
CLASS. The data were split into 2 samples and the following regression results were obtained from
the split data.
SUMMARY OUTPUT
Regression Statistics
Multiple R
0.588
R Square
0.346
Adjusted R Square
0.044
Standard Error
4.55
Observations
20
ANOVA
df
SS
MS
Significance F
Regression
142.0
23.7
1.15
0.391
Residual
13
268.8
20.7
Total
19
410.8
Coefficients
Standard Error
t Stat
P-value
Lower 95%
Upper 95%
Intercept
86.8
25.9
3.4
0.0
30.9
142.8
% of Classes Under 20
-0.171
0.205
-0.838
0.417
-0.613
0.271
% of Classes of 50 or More
-0.266
0.387
-0.688
0.503
-1.102
0.570
-0.127
0.099
-1.276
0.224
-0.341
0.088
Acceptance Rate
1st-Year Students in Top 10% of HS
Class
0.116
0.089
1.304
0.215
-0.076
0.308
2.075
4.018
0.516
0.614
-6.607
10.756
Academic Reputation Score
-0.532
0.408
-1.305
0.215
-1.413
0.349
Student/Faculty Ratio
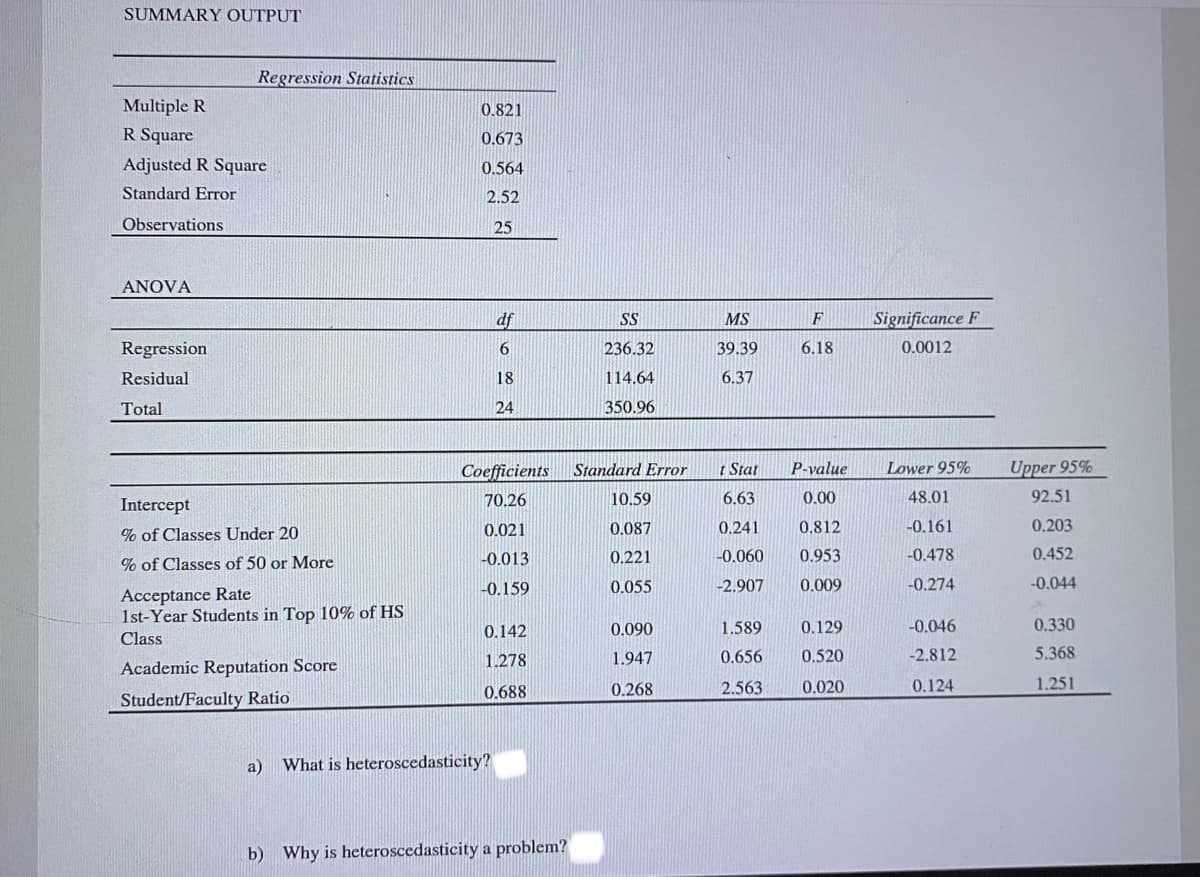
Transcribed Image Text:SUMMARY OUTPUT
Regression Statistics
Multiple R
0.821
R Square
0.673
Adjusted R Square
0.564
Standard Error
2.52
Observations
25
ANOVA
df
F
Significance F
SS
MS
Regression
6.
236.32
39.39
6.18
0.0012
Residual
18
114.64
6.37
Total
24
350.96
Coefficients
Standard Error
t Stat
P-value
Lower 95%
Upper 95%
Intercept
70.26
10.59
6.63
0.00
48.01
92.51
0.021
0.087
0,241
0.812
-0.161
0.203
% of Classes Under 20
-0.013
0.221
-0.060
0.953
-0.478
0.452
% of Classes of 50 or More
-0.159
0.055
-2,907
0.009
-0.274
-0.044
Acceptance Rate
1st-Year Students in Top 10% of HS
0.142
0.090
1.589
0.129
-0.046
0.330
Class
1.278
1.947
0.656
0.520
-2.812
5.368
Academic Reputation Score
0.688
0.268
2.563
0.020
0.124
1.251
Student/Faculty Ratio
a)
What is heteroscedasticity?
b) Why is heteroscedasticity a problem?
Expert Solution
This question has been solved!
Explore an expertly crafted, step-by-step solution for a thorough understanding of key concepts.

This is a popular solution!

Trending now
This is a popular solution!

Step by step
Solved in 2 steps

Recommended textbooks for you
Glencoe Algebra 1, Student Edition, 9780079039897…
Algebra
ISBN:
9780079039897
Author:
Carter
Publisher:
McGraw Hill

Big Ideas Math A Bridge To Success Algebra 1: Stu…
Algebra
ISBN:
9781680331141
Author:
HOUGHTON MIFFLIN HARCOURT
Publisher:
Houghton Mifflin Harcourt
Glencoe Algebra 1, Student Edition, 9780079039897…
Algebra
ISBN:
9780079039897
Author:
Carter
Publisher:
McGraw Hill
Big Ideas Math A Bridge To Success Algebra 1: Stu…
Algebra
ISBN:
9781680331141
Author:
HOUGHTON MIFFLIN HARCOURT
Publisher:
Houghton Mifflin Harcourt