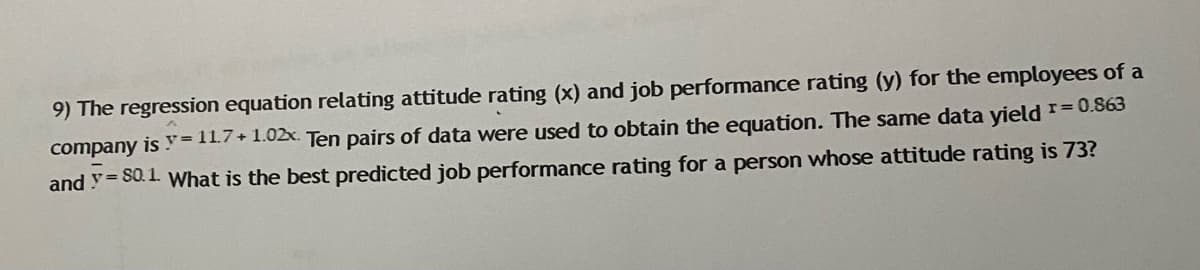
9) The regression equation relating attitude rating (x) and job performance rating (y) for the employees of a company is y= 11.7+1.02x. Ten pairs of data were used to obtain the equation. The same data yield = 0.863 and Y= S0.1. What is the best predicted job performance rating for a person whose attitude rating is 73?
Q: a. Ignore for now the months since the last maintenance service (71 ) and the repairperson who…
A: Here, y is the repair time and x3 = 0 if Bob Jones performed the service and x3 =1 if David Newton…
Q: A county real estate appraiser wants to develop a statistical model to predict the appraised value…
A: From the information, given that Let X denotes the number of rooms. Let Y denotes the appraised…
Q: Different hotels in a certain area are randomly selected, and their ratings and prices were…
A: Linear regression equation:In a linear regression model y = b0 + b1x, where y be the response…
Q: The return rates of crane (Tagak) in Bulacan was studied using regression analysis and this…
A: The relationship between return rate (x: % of birds that return to the colony in a given year) and…
Q: If you know that the equation for the simple linear regression between the final exam result and the…
A: Simple linear regression is a regression model with only one explanatory variable and hence the…
Q: An observational study was conducted to investigate the association between age and total serum…
A: The regression equation was calculated and is as follows: y = 124.4 + 1.6x 1.Estimate the…
Q: Four pairs of data yield r= 0.942 and regression equation y=3x.Also, y= 12.75. What is the best…
A: Given that,, Regression equation y = 3x And x=2.9
Q: A carpenter wanted to predict how many pieces of furniture they could produce in a certain time…
A:
Q: Suppose you are interested in the relationship between educational attainment (measured by years of…
A:
Q: Assume a person got score of 32.5 on Test A and a score of 95.25 on Test B. Using the regression…
A:
Q: A linear relationship between EmployeeSalary (Dependent) and degree(independent) has the following…
A:
Q: The equation used to predict college GPA (range 0-4.0) is y=0.18+0.53x1+0.002x2, where x1 is high…
A: Given, The equation used to predict college GPA is y=0.18+0.53x1+0.002x2, where x1 is high school…
Q: 1. Use the computer output to write the estimated regression equation for predicting birth weight…
A: Since you have posted a question with multiple sub-parts, we will solve the first three subparts for…
Q: A kinesiology major wanted to predict VO2max based on the one-mile run. To develop the regression…
A:
Q: The regression equation is calculated to be y' = 5.333 + 0.777x. After conducting a hypothesis test,…
A:
Q: How can I calculate the different values in the equation y=ax+b for the regression line of a sample?…
A: The form of the simple linear regression is given by,
Q: 7. From the National Educators Survey (N= 450), we learn that the correlation between number of…
A: Since you have posted a question with multiple subparts, we will solve first three subparts for you.…
Q: A time series regression equation measuring the number of surfboards sold by a surfboard…
A: The time series regression equation is given as: Most of the statistical software programs identify…
Q: The personnel director for Electronics Associates developed the following estimated regression…
A: (i). Here -8.69 is the coefficient of length of service, interpretation of this coefficient is that…
Q: The admissions officer for a certain college developed the following estimated regression equation…
A: The admissions officer for a certain college developed the following estimated regression equation…
Q: Assume that there is a positive linear correlation between the variable R (return rate in percent of…
A: Given information: No. of variables=02 Variables under study: 1. Return rate in Percent of a…
Q: The following equation is the result of performing a multiple regression analysis: Job performance =…
A: According to the question, Job performance = 10 + (5*job knowledge) + (0.7*conscientiousness) where…
Q: Firstly, I picked up three variables (X1: average temperature in January, X2: average temperature in…
A: Given information: The data represents the values of the variables Y, X1, X2 and X3.
Q: The researchers decide to use simple linear regression to obtain a regression equation that would…
A: The regression equation is Y = 2.185 + 0.523X, where the independent variable X defines the score of…
Q: The regression equation is Ý = 29.29 – 0.96X, the sample size is 8, and the standard error of the…
A: Given that Sample size n = 8 Standard error of slope = 0.22 Level of significance = 0.01
Q: The regression equation relating attitude rating(x) and job performance (y) for ten randomly…
A: Regression equation:The regression tells about the relationship of two variables, one dependent and…
Q: What is the best predicted test score for a student who spent 120 minutes preparing for the test?
A: Regression equation for dependent random variable Y (test score ) and Independent random variable X(…
Q: A regression study was done for 20 cities with latitude and average May temperature as the…
A: Given information: The data represents the results of regression analysis.
Q: The number of newly reported crime cases in a county in New York State is shown in the accompanying…
A: The regression analysis is conducted using EXCEL. The software procedure is given below: Enter the…
Q: The equation used to predict college GPA (range 0-4.0) is y = 0.17 +0.51x, +0.002x,, where x, is…
A:
Q: Market researchers were interested in the relationship between the number of pieces in a…
A: Given that, the regression model is, Y^ = 0.08*X+1.20 Where x= number of pieces in a set.
Q: A regression between foot length (response variable in cm) and height (explanatory variable in…
A: Thanks for giving opportunity to serve for bartleby students, Hey, There ! Thank you for posting…
Q: he admissions officer for Clearwater College developed the following estimated regression equation…
A: Given Information: The admissions officer for Clearwater college developed the following estimated…
Q: Make up a question that would involve interpolation and the use of the model (regression equation)…
A: Since the question number is not specified, we'll be answering the first question only. Please…
Q: The mall has a set of data with employee age (X) and the corresponding number of annual…
A: Given, regression equation is Y=100-3X If X=30 Y=?
Q: In last year, five ranndomly selected students took a math aptitude test before they began their…
A:
Q: The accompanying table shows results from regressions performed on data from a random sample of 21…
A: The table of regression equations given in the question is: sample size n= 21 y: response variable…
Q: An automotive blogger wants to predict the value of a certain model of sedan, y, in thousands of…
A: Solution : Given that : the multiple regression equation yˆ= 24.24 − 1.207X1 − 0.01763X2
Q: A group of scientists and engineers aim to create fuel-efficient and fuel-efficient cars. In order…
A: Given data: Given regression model; Y = 40.15−0.513X To find: what would be the weight of a car…
Q: A professor decides to investigate the relationship between midterm exam score and final exam score…
A: Given r2=0.74
Q: Different hotels in a certain area are randomly selected, and their ratings and prices were…
A: The equation of the regression line is: ^y= -370 + 140x where , ^y = dependent variable x =…
Q: A researcher investigates the relationship between cigarette smoking (X) and work absences (Y). The…
A: 1. For dependent random variable y and the independent random variable x, the simple linear…
Q: Based on the data from six students, the regression equation relating number of hours of preparation…
A: Given, Regression equation is, y^=67.3+1.07x And Want to predict for 120 minutes, means…
Q: A linear regression equation has b = 3 and a =– 6. What is the predicted value of Y for X = 4?
A: First, we will identify the regression equation and then find the solution.
Q: The admissions officer for a certain college developed the following estimated regression equation…
A: As the multiple linear regression equation is given by, ŷ = −1.39 + 0.0234x1 + 0.00482x2 where A…
Q: In a fisheries researchers experiment the correlation between the number of eggs in tge nest and the…
A: Given y =0.72x + 17.07 X=140
Q: If the equation of the regression line that relates income in dollars of student’s parents, xx, with…
A: We have to find correct answer..
Q: When you are deciding which variables to include as predictors in a multiple regression equation,…
A: Multiple linear regression model: A multiple linear regression model is given as y = b0 + b1x1 +…
Q: Assume there is a positive linear correlation between the variable R (Return rate in percent of a…
A:
Q: The regression equation for the association between BMI and total cholesterol level is: ŷ = 28.07 +…
A: The regression equation is: y^=28.07+6.49x Here, the variable X is the BMI and Y is the total…
Trending now
This is a popular solution!
Step by step
Solved in 2 steps
- Olympic Pole Vault The graph in Figure 7 indicates that in recent years the winning Olympic men’s pole vault height has fallen below the value predicted by the regression line in Example 2. This might have occurred because when the pole vault was a new event there was much room for improvement in vaulters’ performances, whereas now even the best training can produce only incremental advances. Let’s see whether concentrating on more recent results gives a better predictor of future records. (a) Use the data in Table 2 (page 176) to complete the table of winning pole vault heights shown in the margin. (Note that we are using x=0 to correspond to the year 1972, where this restricted data set begins.) (b) Find the regression line for the data in part ‚(a). (c) Plot the data and the regression line on the same axes. Does the regression line seem to provide a good model for the data? (d) What does the regression line predict as the winning pole vault height for the 2012 Olympics? Compare this predicted value to the actual 2012 winning height of 5.97 m, as described on page 177. Has this new regression line provided a better prediction than the line in Example 2?The following fictitious table shows kryptonite price, in dollar per gram, t years after 2006. t= Years since 2006 0 1 2 3 4 5 6 7 8 9 10 K= Price 56 51 50 55 58 52 45 43 44 48 51 Make a quartic model of these data. Round the regression parameters to two decimal places.8. Given the equation of a regression line is = -5.5x - 9.4, what is the best predicted value for y given x = -3.1? Assume that the variables x and y have a significant correlation.
- A company has a set of data with employee age (X) and the corresponding number of annual on-the-job-accidents (Y). Analysis on the set finds that the regression equation is Y=60-0.5*X. What can be said of the correspondence (relation) between age and accidents? Are younger workers safer or more prone to accident? What is the likely number of accidents for someone aged 25?In a fisheries researcher's experiment, the correlation between the number of eggs in the nest and the number of viable (surviving) eggs for a sample of nests is r = 0.67. The equation of the regression line for number of viable eggs y versus number of eggs in the nest x is y = 0.72x + 17.07. For a nest with 140 eggs, what is the predicted number of viable eggs?The admissions officer for a certain college developed the following estimated regression equation relating the final college GPA to the student's SAT mathematics score and high school GPA. ŷ = −1.39 + 0.0234x1 + 0.00482x2 where x1 = high-school grade point average x2 = SAT mathematics score y = final college grade point average. #1)A high-school average 84 corresponds to x1 = 84 and a score of 535 on the SAT mathematics test corresponds to x2 = 535. Substitute these values into the estimated regression equation to find the final college GPA, rounding the result to two decimal places. GPA = −1.39 + 0.0234x1 + 0.00482x2 = -1.39 +0.0234 (_____________) + 0.00482 (535) = __________________
- The estimated regression equation for a model involving two independent variables and 10 observations follows.A professor decides to investigate the relationship between midterm exam score and final exam score (in points ) of students in her introductory statistics class after taking a sample of students she finds r2=0.74 and the regression equation is final exam score=40+0.95 a correct interpretation of r2 =0.74 would be ? A) 74% of the predicted final exam scores will be correct B) 74 % of the variation in midterm exam score can be explained by the straight line relationship with final exam score c) 74%of students will have higher final exam scores than midterm exam scores D)74% of the variation in final exam score can be explained by the straight line relationship with midterm exam scoreAn observational study was conducted to investigate the association between age and total serum cholesterol. The study involved 125 participants with an average age of 44.3 and an age range between 35-55 years. The regression equation was calculated and is as follows: y = 124.4 + 1.6x 1.Estimate the total serum cholesterol for a 50-year old person. 2. Estimate the total serum cholesterol for a 44-year old person. 3. Would it be appropriate to utilize the equation to predict a 70-year old individual’s cholesterol level? Please explain your answer.
- If a sample of 25 pairs of data yields a correlation coefficient, r, of 0.390 and the scatterplot displays a linear trend, can you use the regression equation to make predictions, assuming your x-values are within the domain of the data set? Choose your answer from the multiple choice answers below A.) Yes, because rcrit = 0.396 and the regression coefficient, r, is less than this value. B.) Yes, because rcrit = 0.381 and the regression coefficient, r, is greater than this value. C.) No, because rcrit = 0.381 and the regression coefficient, r, is greater than this value. D.) No, because rcrit = 0.396 and the regression coefficient, r, is less than this value.Assume that there is a positive linear correlation between the variable R (return rate in percent of a financial investment) and the variable t (age in years of the investment) given by the regression equation R = 2.3t + 4.8. Without further information, can we assume there is a cause-and-effect relationship between the return rate and the age of the investment? If the investment continues to grow at a constant rate, what is the expected return rate when the investment is 7 years old? If the investment continues to grow at a constant rate, how old is the investment when the return rate is 30%?The estimated regression equation for a model involving two independent variables and 10 observations follows. Y=25.7067 + 0.2795x1 + 0.7337x2 A. Interpret b1 and b2 in this estimated trgression equation. B1 = ? B2 = ? Thank you