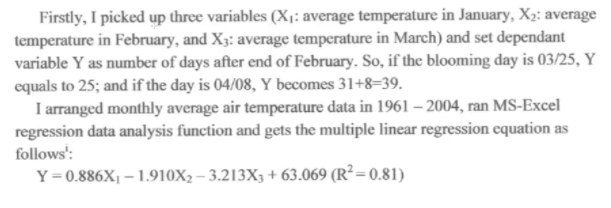
Firstly, I picked up three variables (X1: average temperature in January, X2: average temperature in February, and X3: average temperature in March) and set dependant variable Y as number of days after end of February. So, if the blooming day is 03/25, Y equals to 25; and if the day is 04/08, Y becomes 31+8=39. I arranged monthly average air temperature data in 1961 – 2004, ran MS-Excel regression data analysis function and gets the multiple linear regression equation as follows': Y=0.886X1 – 1.910X2– 3.213X3 + 63.069 (R²= 0.81)
Firstly, I picked up three variables (X1: average temperature in January, X2: average temperature in February, and X3: average temperature in March) and set dependant variable Y as number of days after end of February. So, if the blooming day is 03/25, Y equals to 25; and if the day is 04/08, Y becomes 31+8=39. I arranged monthly average air temperature data in 1961 – 2004, ran MS-Excel regression data analysis function and gets the multiple linear regression equation as follows': Y=0.886X1 – 1.910X2– 3.213X3 + 63.069 (R²= 0.81)

Algebra & Trigonometry with Analytic Geometry
13th Edition
ISBN:9781133382119
Author:Swokowski
Publisher:Swokowski
Chapter7: Analytic Trigonometry
Section7.6: The Inverse Trigonometric Functions
Problem 94E

Related questions
Question
Can someone explain to me how this person set up the his multiple linear regression equation in excel when he ran a regression? I assume his X
Transcribed Image Text:Firstly, I picked up three variables (X1: average temperature in January, X2: average
temperature in February, and X3: average temperature in March) and set dependant
variable Y as number of days after end of February. So, if the blooming day is 03/25, Y
equals to 25; and if the day is 04/08, Y becomes 31+8=39.
I arranged monthly average air temperature data in 1961 – 2004, ran MS-Excel
regression data analysis function and gets the multiple linear regression equation as
follows':
Y=0.886X1 – 1.910X2 – 3.213X3 + 63.069 (R²=0.81)
Expert Solution
This question has been solved!
Explore an expertly crafted, step-by-step solution for a thorough understanding of key concepts.

Step by step
Solved in 2 steps

Recommended textbooks for you
Algebra & Trigonometry with Analytic Geometry
Algebra
ISBN:
9781133382119
Author:
Swokowski
Publisher:
Cengage

Algebra and Trigonometry (MindTap Course List)
Algebra
ISBN:
9781305071742
Author:
James Stewart, Lothar Redlin, Saleem Watson
Publisher:
Cengage Learning

Algebra: Structure And Method, Book 1
Algebra
ISBN:
9780395977224
Author:
Richard G. Brown, Mary P. Dolciani, Robert H. Sorgenfrey, William L. Cole
Publisher:
McDougal Littell
Algebra & Trigonometry with Analytic Geometry
Algebra
ISBN:
9781133382119
Author:
Swokowski
Publisher:
Cengage
Algebra and Trigonometry (MindTap Course List)
Algebra
ISBN:
9781305071742
Author:
James Stewart, Lothar Redlin, Saleem Watson
Publisher:
Cengage Learning
Algebra: Structure And Method, Book 1
Algebra
ISBN:
9780395977224
Author:
Richard G. Brown, Mary P. Dolciani, Robert H. Sorgenfrey, William L. Cole
Publisher:
McDougal Littell